Transcription of Our key performance indicators (KPis) 2015–20
1 Slugline27sluglineOur key performance indicators ( kpis ) 2015 20To help measure our progress on how well we are adding value for our stakeholders and delivering the outcomes described on page 26, we focus on a range of financial and operational kpis , as defined below. These kpis are set for the five-year period of our short-term planning horizon and encompass the important areas of customer service and environmental performance , as well as financial indicators , taking into consideration the interests of all of our stakeholders. Strong performance across these kpis would indicate that our strategy is delivering on our targeted outcomes, helping us on our path to reaching our long-term strategic operational kpis have evolved to reflect the move to a totex price control for the 2015 20 regulatory period, with a totex outperformance measure replacing the previous separate opex outperformance and capex outperformance measures.
2 We now include an outcome delivery incentive (ODI) KPI in our wholesale business to monitor our performance against these important new operational measures. This replaces the previous serviceability KPI which is incorporated within the ODI measures. With the retail household price control now being separated, we have introduced a new KPI to measure our costs in this area. In the business retail price control, with the expansion of competition, we have included a new KPI measuring the impact of customer gains and financial kpis are the same as for the previous year except that we will no longer be including capital investment specifically due to Ofwat s move away from opex and capex and into the new totex based price control for 2015 20.
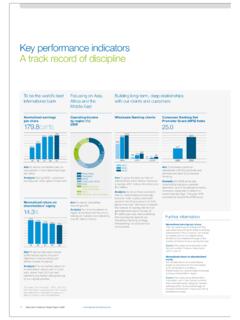
3 Our executive bonuses and long-term incentives are intrinsically linked to our financial and operational performance kpis as highlighted in the remuneration report on pages 82 to KPIsIn respect of our financial kpis , we use underlying profit measures as these enable more meaningful comparisons of the year-on-year performance of our business. KPID efinitionPerformanceRevenueA definition of revenue is included within the Accounting policies note on page 155 1,730m + 1,730m14/15 1,720 m13/14 1,68 9m12/13 1,63 6m11/12 1,565mUnderlying operating profit The underlying operating profit measure excludes from the reported operating profit any restructuring costs and other significant non-recurring items.
4 The group determines adjusted items in the calculation of its underlying operating profit measure against a framework which considers significance by reference to profit before tax, in addition to other qualitative factors such as whether the item is deemed to be within the normal course of business, its assessed frequency of reoccurrence and its volatility which is either outside the control of management and/or not representative of the current year performance . A reconciliation is shown on page 44 604m 604m14/15 664m13/14 635m12/13 604m11/12 594mUnderlying earnings per share This measure deducts underlying net finance expense and underlying taxation from underlying operating profit to calculate underlying profit after tax and then divides this by the average number of shares in issuance during the year.
5 Underlying net finance expense makes adjustments to the reported net finance expense, including the stripping out of fair value movements. Underlying taxation strips out any prior year adjustments, exceptional tax or any deferred tax credits or debits arising from changes in the tax rate from reported taxation. Reconciliations to the underlying measures above are shown on page per shareThis measure divides total dividends declared by the average number of shares in issuance during the + : net debt to regulatory capital valueGroup net debt (including derivatives) divided by UUW s regulatory capital value (Ofwat s published RCV in out-turn prices)Our target range is 55% to 65%61% + Utilities GroUp plC AnnUAl report And FinAnCiAl stAtements 2016 Stock Code: 28sluglineOperational KPIsThese operational kpis feed through from our three strategic themes: the best service to customers; at the lowest sustainable cost.
6 And in a responsible objective/KPID efinitionTa rge tPerformanceBest service to customersWholesale outcome delivery incentive (ODI) composite Net reward/(penalty) accrued across United Utilities 19 wholesale financial ODIsRange of + 30m to - 70m over 2015 202015/16: net rewardODIs only introduced in 2015/16 so no prior year comparatorsService incentive mechanism qualitative Ofwat derived index based on quarterly customer satisfaction surveys, measuring the absolute and relative performance of the 18 water companies (previously 19 in 2014/15). Each company receives a score in the range of zero to five, with five being the highest attainable scoreTo move towards the upper quartile in the medium-term15 bestSector worstNew methodology for 2014/15, hence no prior year comparatorsService incentive mechanism quantitative Ofwat derived composite index based on the number of customer contacts, assessed by type, measuring the absolute and relative performance of the 18 water companies (previously 19 in 2014/15).
7 Each company receives a SIM point total, where the lowest score represents the best performance To move towards the upper quartile in the medium-term15/1614/159599 Sector best (see note 2)Sector worst (see note 2)New methodology for 2014/15, hence no prior year comparatorsBusiness retail customer growthAmount of additional annualised revenue from winning customers from other water retail providers less the amount of revenue lost from losing customers to other water retail providersSee note 1 below15/16 18m14/15 15m13/14 10m 0m12/13**Scottish licence granted in 2012/13 Lowest sustainable costTotex outperformanceProgress to date on delivering our promises to customers within the cumulative 2015-20 wholesale totex final determination allowanceTo meet Ofwat s final determination totex allowance2015 20.
8 On track to meet the final determination allowanceTotex new measure for 2015-20 period hence no prior years comparatorsFinancing outperformanceProgress to date on financing expenditure outperformance secured versus Ofwat s industry allowed cost of debt of per cent real over the 2015 20 periodTo beat Ofwat s industry allowed cost of debt 2015 20: On track to beat Ofwat allowance2010 15: Exceeded 300m targetDomestic retail cost to serveCost to serve in our domestic retail business compared with Ofwat s revenue allowanceTo minimise costs compared with Ofwat s revenue allowance2015/16: 10m outperformanceDomestic retail allowance first introduced by Ofwat for 2015-20 period hence no prior years comparatorsResponsible mannerLeakage average annual leakage Average annual water leakage from our network quantified in megalitres per dayTo meet our regulatory leakage target, as set by Ofwat2015/16: 463Ml/d - Met target2014/15: 454Ml/d Met target2013/14: 452Ml/d Met target2012/13: 457Ml/d Met target2011/12.
9 453Ml/d Met targetEnvironment Agency performance assessmentComposite assessment produced by the Environment Agency, measuring the absolute and relative performance of the 10 water and wastewater companies across a broad range of areas, including pollution To be a first quartile performer on a consistent basis14/15*2nd13/142nd12/132nd11/123rd10 /117th*2014/15 latest available assessmentDow Jones Sustainability Index ratingIndependent rating awarded using sustainability metrics covering economic, environmental, social and governance performanceTo retain World Class rating each year2015/16: World Class 2014/15: World Class 2013/14: World Class 2012/13: World Class 2011/12: World Class Our performance and the progress we have made against our objectives and their associated kpis are included within the business performance section on pages 30 to 1: No target set due to the proposed joint venture of United Utilities and Severn Trent s non-household retail businesses.
10 Note 2: Sector best and worst on quantitative SIM based on datashare of 10/19 water companies for 2014/15 and 13/18 water companies for 2015/16 (based on nine months of actuals).United Utilities GroUp plC AnnUAl report And FinAnCiAl stAtements 2016 Stock Code: 29 SHAREHOLDER INFORmATIONFINANCIAL STATEmENTSOUR GOVERNANCESTRATEGIC REPORT
