Transcription of OUR KEY PERFORMANCE INDICATORS - plc.aggreko.com
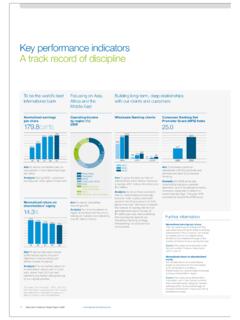
1 OUR K E Y PERFORMANCE INDICATORS . How we performed Customer Focus, Capital & Operational Efficiency, Technology Investment and Expert People and their related KPIs provide a clear tool to measure the delivery of our strategic priorities; the remaining financial KPIs are directly impacted by this PERFORMANCE and are the resulting outcome. CUSTOMER FOCUS. Customer loyalty Customer activity Measure Measure Group Average Power MW on-hire Net Promoter Score (NPS). From 2018 Group average power megawatts this will be known as Aggreko Listens.
2 The data gathered will be more on-hire. Historically we have reported Power Solutions Utility order intake 6,613 MW j comprehensive and therefore and off-hire rate. This does not represent 2017 6,613. how we present this may change. the whole Group, only a part of it and 2016 6,571. therefore this year we have changed the Relevance metric to better reflect the business mix. 2015 6,771. It is important that we understand the 2014 6,621. extent to which we meet our customers' Relevance needs. NPS measures the proportion Average megawatts on-hire across the 2013 6,625.
3 Of our customers who think we do an year provides a good measure of the excellent job against those who think activity of the business globally. It also we are average or worse. provides a good indicator of how our strategy, sales approach and pricing Target are being received in the market. Sustainable improvements in the NPS. over time. Target Over time we aim to increase the PERFORMANCE average megawatts on-hire, however The improvement in the year has mainly this cannot be at the expense of been driven by an improvement in price and therefore this KPI should customer feedback in Rental Solutions, always be considered alongside the as the strategic measures we have financial metrics.
4 Implemented take effect. PERFORMANCE During the year we have seen a very Net Promoter Score slight improvement in the average 65%. megawatts on-hire, however the j chart also shows that over the past five years this metric has been fairly 2017 65%. steady. This demonstrates the resilience 2016 63% of our business and the strength of the product and brand. 2015 63%. 2014 58%. 2013 64%. Read more about our Read more about the PERFORMANCE customer initiatives page 24 of the business page 36. 32 A G G R E K O P L C A NNU A L R E P O R T A N D A C C O UN T S 2 017.
5 OVERVIEW BUSINESS STR ATEGY OUR PERFORMANCE GOVERNANCE FINANCIAL &. OTHER INFORMATION. CAPITA L & OPER ATIONA L EFFICIENCY TECHNOLOGY INVESTMENT. Capital activity Fleet size and composition Measure Power Solutions: Industrial Utilisation Measure Fleet utilisation by business unit. Total power fleet size (in MW), split Relevance 68% j between generation type (diesel, diesel G3+, gas, Next Generation Gas We are a capital intensive business and 2017 68% (NGG), HFO). in order to generate strong returns on our capital investment our fleet needs 2016 63% Relevance to be well utilised.
6 Across our businesses 2015 65% Our strategy is to grow ahead of the we use physical utilisation as a metric market. To remain competitive we 2014 65%. (average MW on-hire divided by the have to offer our customers cheaper total fleet size in MW). 2013 62% and cleaner sources of energy that can be adapted to meet their needs. Target The best way to do this is through more In our Rental Solutions and Power fuel efficient engines and using cheaper Solutions Industrial businesses we are Power Solutions: Utility Utilisation and cleaner fuels where appropriate.
7 74%. targeting utilisation of between 60-70%, whilst in our Power Solutions Utility x Target business we target over 80%. Increasing proportions of our market 2017 74% leading products in fuel efficiency, PERFORMANCE the diesel G3+ and Next Generation Gas 2016 79%. In 2017 we saw utilisation in our engine, and the introduction of clean Rental Solutions and Power Solutions 2015 77%. energy sources such as solar and storage. Industrial businesses improve as our 2014 76%. business priority initiatives helped PERFORMANCE grow our businesses.
8 We need to see 2013 74% During the year we have refurbished further improvements to meet our more diesel engines to the G3+ and targets, but the progress is encouraging. introduced more NGG engines. We have Rental Solutions Utilisation also begun to introduce solar, but this In our Power Solutions Utility business is immaterial in the context of the order intake was slow in the first part of the year, and so utilisation fell. 56% j overall fleet. 2017 56%. Power Fleet Composition at 31 December 2017. 2016 52%. 2015 55% 9,920 MW. 2014 57% 1 Diesel 64% (71%).
9 45. 2013 57% 2 Diesel G3 +14% (8%). 3. 3 Gas 18% (18%). 4 NGG 3% (2%). 5 HFO 2% (1%) 2. 1. (2016 total: 9,666 MW. figures in parentheses). Read more about Read more about our Capital & operational efficiency page 27 technology initiatives page 28. A G G R E K O P L C A NNU A L R E P O R T A N D A C C O UN T S 2 017 33. OUR K E Y PERFORMANCE INDICATORS (CONTINUED). SOCIAL. EXPERT PEOPLE. Safety Employee satisfaction Underlying revenue growth Measure Measure Measure Lost Time Injury Frequency Rate (LTIFR). Employee turnover. Revenue growth excluding the impact of currency movements Relevance Relevance and pass through fuel.
10 Rigorous safety processes are absolutely It is the attitude, skill and motivation of essential if we are to avoid accidents our people which makes the difference Relevance or incidents which could cause injury between mediocre and excellent As a business that is exposed to different to people and damage to property PERFORMANCE . We monitor permanent cycles, we look at revenue growth over and reputation. The main KPI we use employee turnover as a reasonable proxy time and compare this to how the to measure safety PERFORMANCE is Lost for how employees feel.

