Transcription of Key performance indicators - AA Annual Report 2017
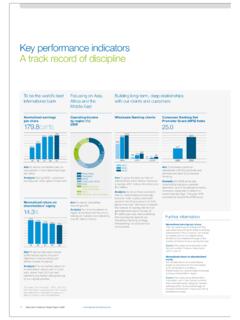
1 22 AA plc Annual Report and Accounts 2017 Key performance indicatorsHigh recurring revenue and cash flow generation arising from strong Tr ad i n g E B ITDAKey strength Strategic objectiveKPID efinitionDataExecutive directors Remuneration 403m + EBITDA The key measure of segmental performance is considered to be Trading EBITDA, being earnings before interest, tax, depreciation and amortisation and excluding exceptional items, items not allocated to a segment, discontinued operations and businesses held for sale. In the current period, items not allocated to a business segment principally relate to the difference between the cash contributions to the pension schemes for ongoing service and the calculated Annual service cost and share-based cash bonus 70% based on Trading EBITDA. Remaining 30% subject to Trading EBITDA cash flow generation92% -9pptCash conversion Net cash inflow from continuing operating activities before tax and exceptional items divided by Trading EBITDA.
2 + Ratio of net debt to Trading EBITDA for continuing operations for the last 12 months (see page 28).Individual objective for cash bonus for borrowings and associated interest + coverTrading EBITDA divided by total ongoing cash finance costs (see note 6). Individual objective for cash bonus for borrowings010020030040050020162017403402 Trading EBITDA ( m) 0204060801001202016201792101 Cash conversion (%) coverShareholder value+3%Tot al Shareholder Return (%)Lo ng Ter m Incentive Plans share performance shareholder return represents the change in closing value of a share held from the IPO to 31 January 2017 plus the value of any dividends paid during that period. This has been measured using the share price on initial admission of STRONG FINANCIAL performance LEADING TO THE DELIVERY OF SUSTAINABLE SHAREHOLDER RETURNSCREATE SHAREHOLDER VALUEOur key performance indicators (KPIs)reflect the AA s strong fundamental characteristics (listed in the Executive Chairman s statement) and provide the basis of the transformation which we will deliver through our strategic priorities which are explained in the Strategic Journey.
3 The KPIs below reflect both those fundamental characteristics and our progress against the strategic priorities. The performance underlying these KPIs is explained in Our performance and the Financial strength Strategic objectiveKPID efinitionDataExecutive directors RemunerationAA plc Annual Report and Accounts 2017 23 Our BusinessGovernanceFinancial StatementsOur PerformanceKey strength Strategic objectiveKPID efinitionDataExecutive directors Remuneration01,0002,0003,0004,0002016201 73,3353,331 Paid personal Members (000s) 04,0008,00012,000201620179,97610,216 Business customers (000s) Paid personal Members (millions)Individual criteria of bonus of Executive of personal Members excluding free Memberships at the period customers (millions) Number of business customers at the period leader in Roadside Assistance + of employees in the UK that attended of breakdowns Breakdowns attended (millions) Scale and barriers to entryStrong market positions in other policies (millions)
4 Total policies sold in the last 12 months excluding business customers within Home Services. 2,607 + ,877 + of driving school instructors at the period driving instructors 05001,0001,5002,0002,500201620171,8792,0 74 Insurance policies (000s) 05001,0001,5002,0002,5003,000201620172,6 072,574 Franchised driving instructors 01,0002,0003,0004,000201620173,6353,459 Breakdowns attended (thousands) 01000200030004000201620172,8772,881 Patrols STRENGTHEN THE AA AS THE PRE-EMINENT MEMBERSHIP SERVICES ORGANISATION IN THE UK AND REVOLUTIONISE CUSTOMER EXPERIENCE05010015020020162017158156 Average income per personal Member ( ) 048121620201620172018 Average income per business customer ( ) Average incomeIndividual criteria of bonus of Executive income per personal Member excluding free Memberships. 20 + Average income per business customer. 158 + AA plc Annual Report and Accounts 2017 ROADSIDE ASSISTANCER oadside Assistance reached an important milestone with the reversal of the long term decline of paid personal Members.
5 Trading Revenue grew and Trading EBITDA rose Trading Revenue excluding business disposed of 742m( 724m)Breakdowns attendedAverage income per paid Member (excluding free Membership)Average income per business customerBusiness CustomersPaid personal Members (excluding free Memberships)Trading EBITDA excluding business disposed of 365m( 361m)Trading EBITDA margin ( )Our ( ) 158( 156) 20( 18) ( ) ( )Headlines Paid personal Members up to 3,335k with retention increased to 82% and new business volumes up 14% Income per personal Member rose to 158 per Member driven by improved ancillary sales Retained business contracts with Hyundai, Lotus and McLaren among others Income per business customer up to 20 per customer driven by increased breakdowns attended Awarded Which? Recommended Provider status for both consumer and AA-provided manufacturer breakdown cover for the 11th year in a row OverviewRoadside Assistance performance is driven by our highly valued personal Member base.
6 However, business customers provide close to half the jobs for the patrol force, supporting the scale of our operations, which is critical to our success. Roadside Assistance also includes additional services such as vehicle inspections, AA Cars, AA Tyres, connected car and publishing. Collectively these businesses generate approximately 5m of Trading EBITDA. Financial performanceRoadside Assistance Trading Revenue grew to 742m, driven by the increase in average income for both paid personal Members and business customers . We have turned around the long term decline of paid personal Members, reaching an important milestone in the return to growth since May. Average income per paid personal Member rose to 158 (2016: rise) driven by improved sales of ancillary products. With more parts sold by patrols, ancillary revenue rose 17% on the prior year. The 27% rise in battery sales volumes followed the adoption of the new testing equipment and payment processes, enabling higher service levels.
7 The combination of enhancements to our product offering, more rational pricing, our higher profile through advertising, more highly valued customer rewards and our improved online capabilities has driven both new sales and retention. Revenue from new Members rose due to a 14% increase in new business volumes, driven particularly by our improved online capabilities. Our retention rate rose to 82% (2016: 81%). Improvements to the Membership proposition mean we are receiving fewer calls from Members requesting a review of their cover. Our Stay AA team have overcome some operational issues at the start of the year and continue to retain more of those who call and at lower discounts. We also grew revenue in the business-to-business segment, largely due to the 11% increase in revenue per customer. This is partly driven by the benefit of the rise in breakdown incidents under pay-for-use contracts and offsets a decline in business customers held with our banking partners. Trading EBITDA increased by 4m to 365m with revenue growth partly offset by increased breakdown incidents.
8 Savings generated by efficiencies in the patrol force and call centres limited the cost impact from higher breakdowns to 6m. Trading EBITDA margin decreased from to review p26AA plc Annual Report and Accounts 2017 25 Our BusinessGovernanceFinancial StatementsOur PerformanceINSURANCE SERVICESDRIVING SERVICESP olicy numbers includes Home Services Driving instructorsAverage income per policy Financial Services productsTrading Revenue 131m( 131m)Trading Revenue 67m( 68m)Trading EBITDA 76m( 78m)Trading EBITDA 20m( 19m)Trading EBITDA margin ( )Trading EBITDA margin (27. 9 %) ( ) 70( 63)100k(33k)2,607(2,574)Headlines Total policy numbers down 9% but experienced the first motor insurance policy growth since 2008, driven in part by the in-house Underwriter Financial Services revenue increased as our partnership with the Bank of Ireland continues to build positive momentum Our core products of motor and home insurance achieved the top five-star rating from Defaqto again OverviewWe arranged policies last year for motor and home insurance andHome Services which provides emergency boiler and heating system launched our in-house Insurance Underwriter in January 2016 to participate on the AA s motor insurance panel and, from August, on the AA s home insurance panel.
9 Our Financial Services partnership with the Bank of Ireland builds on a long history of AA financial services. Financial performanceTrading Revenue was flat at 131m with lower core insurance and Home Services revenue offset by growth in Financial Services. This performance does not, however, demonstrate the headway we have made in this division. Motor insurance achieved growth in policies for the first time since 2008, benefitting in part from new sales through our in-house Underwriter, which performed ahead of expectations. In its first year of business, we underwrote 115,000 motor insurance policies. The 9% drop in total insurance policies was driven by the planned decline in travel insurance which has lower average premiums than the rest of our portfolio. As result, total average income per policy rose from 63 to 70. Financial Services revenue increased as our partnership continues to build positive momentum utilising the inherent strength of the AA brand and marketing expertise of the AA.
10 Trading EBITDA declined to 76m due to higher marketing spend on insurance aggregators and a lower contribution from Home Services as we focus on future profitability over volume. These factors, along with the ramp-up of the Financial Services revenue, resulted in a lower Trading EBITDA margin of (2016: ).Financial review p26 Headlines Driving School franchisee numbers increase due to improvements in franchise offering Decline in number of speed awareness courses delivered by DriveTech Profitability protected through efficiency savingsOverviewThis division comprises Driving Schools and DriveTech. Through the AA and BSM brands the AA is the largest driving school in the UK and DriveTech is the market leader in providing speed awareness courses for police forces in the UK and fleet training performanceDriving Services Trading Revenue declined by 1m to 67m as the higher number of Driving School instructors partially offset a lower number of police speed awareness courses delivered by increase in Driving School revenue was in line with the 1% rise in the number of franchised instructors, a reversal of the recent decline.