Transcription of Peerless Pump Company - gsengr.com
1 Peerless Pump Company Indianapolis IN, 46207-7026 TECHNICAL INFORMATION Bulletin NUMBER SEVEN How to Use System-Head Curves You can avoid some pumping pitfalls by using system-head curves in conjunction with pump performance curves. In this article a pump expert shows graphically how to analyze a number of different situations. By MELVIN MANN Peerless Pump Company A system-head curve is a graphical representation of the relationship between flow and hydraulic losses in a given piping system. Since hydraulic losses are functions of rate of flow, size and length of pipe, and size, number and type of fittings, each system has its own characteristic curve and specific values.
2 In virtually all pump applications at least one point on the system curve is given to the pump manufacturer in order to help him select the pump properly. In many cases, however, it is highly desirable to graphically superimpose the entire system curve over the head-capacity curve of the pump. The intersection of the pump curve with the system-head curve defines the operating point of the pump. This article reviews, by typical examples, methods of calculating system heads for some common piping layouts and discusses some of the factors which are brought to light by superimposing system curves over pump performance curves.
3 Hydraulic losses in piping systems are composed of the following: pipe friction losses; fitting losses (valves, elbows, etc.); entrance and exit losses (these normally occur at the beginning and end of a pipeline, respectively); losses due to change in pipe size by sudden or gradual enlargement or reduction in diameter. In the application of low-head, high-capacity pumps , such as mixed-flow or axial-flow pumps , it is imperative that, when applicable, each of these losses be accurately accounted for, because they usually represent a significant fraction of the total system head.
4 However, in applications involving relatively high static lift and/or relatively high pipe friction losses (long lines) it is usually unnecessary to account for losses other than pipe friction, since these other losses are an insignificant portion of the total head. Except for the first two examples to follow, we shall take into account only losses resulting from pipe friction. However, in actual practice each application should be checked to see what is the order of magnitude of the various hydraulic losses. A decision can then be made as to what losses should be accounted for and what ones can be neglected.
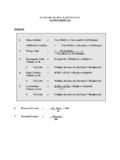
5 NO LIFT ALL FRICTION HEAD The system-head curve, in the absence of static lift, starts at zero flow and zero head. Since friction losses vary as the square of flow rate, this system is parabolic in shape and is a steep system curve. For the case illustrated, here s how the point on the curve is calculated for a flow of 900 gpm. of water: Page 1 Entrance loss from tank into 10-in. suction pipe = = gFriction loss in 2 ft. of 10-in. suction pipe = Loss in 10-in. 90-deg. Elbow connected to pump (equivalent to 25 ft. of 10-in. pipe) = Friction loss in 3,000 ft.
6 Of 8-in. discharge pipe = Loss in 8-in. gate valve fully open (equivalent to 5 ft. of 8-in. pipe) = Exit loss from 8-in. pipe into tank = V /2 = 2g Total friction loss H = ft. fFriction losses at other flow rates can be computed and plotted to get the system-head curve shown. If all losses were ignored except friction through the discharge pipe the total system head would not change significantly. MOSTLY LIFT LITTLE FRICTION HEAD The system-head curve here starts at the static lift H and zero flow.
7 Since, by assumption, friction loss H is relatively small compared to H, we get a flat system curve. For the case illustrated, here is the calculation of H for a flow of 15,000 gpm.: sfsf Friction loss in 20 ft. of 24-in. pipe = ft. Exit loss from 24-in. pipe into tank = V /2 = 2g Total friction loss H f = ft. In this example almost 90 percent of the total head of 17 ft. at 15,000 gpm. consists of static lift. However, it should be noted that neglecting the friction and exit losses would result in an appreciable error.
8 A combination of these two cases is encountered quite often, , where both friction head and static lift are appreciable. The system-head curve is similar to that of the first case with the addition of the static lift. NEGATIVE LIFT (GRAVITY HEAD) In this particular installation flows up to 7,200 gpm. will occur by gravity head alone. To obtain flow rates beyond this, however, requires a pump to overcome the pipe friction losses in excess of 50 ft. The following data define three points on the system-head curve: TIB#7 At 5,000 gpm., friction loss in 1,000 ft. of 16-in. pipe = 25 ft. At 7,200 gpm., friction loss = available gravity head = 50 At 13,000 gpm.
9 , friction loss = 150 TWO DIFFERENT PIPE SIZES Friction losses vs. flow rate are plotted independently for the two pipe sizes. At any given flow rate the total friction loss for the system is the combined loss for the two lines. Thus the combined system curve represents the sum of static lift and the friction losses for all portions of the line. At 150 gpm., friction loss H in 200 ft. of 4-in. pipe = 5 ft. 1fAt 150 gpm., friction loss H in 200 ft. of 3-in. pipe =19 2fStatic lift H =10 s Total head H at 150 gpm.
10 = 34 ft. TWO DIFFERENT STATIC LIFTS System curves are plotted independently for the two lines. The total system curve is then obtained by adding flow rates for the two lines at the same head. At 550 gpm., friction loss in 1,000 ft. of 8-in. pipe = 10 ft. At 1,150 tpm., friction loss = 38 At 1,150 gpm., friction + lift in Line 1 = 38 + 50 = 88 At 550 gpm., friction + lift in Line 2 = 10 + 78 = 88 Therefore, the flow rate for the total or combined system at a head of 88 ft.


