Transcription of People in Jail and Prison in Spring 2021
1 People in jail and Prison in Spring 2021 Jacob Kang-Brown, Chase Montagnet, and Jasmine Heiss June 2021 When the COVID-19 pandemic was first detected in the United States, it was clear that the virus would cause widespread suffering and death among incarcerated People . Advocates were quick to call for Prison and jail releases. However, a little more than a year later, decarceration appears to have stalled. After an unprecedented 14 percent drop in incarceration in the first half of 2020 from million People to million incarceration declined only slightly from fall 2020 to Spring 2021. Generally, states that started 2020 with higher incarceration rates made fewer efforts to reduce incarceration through Spring 2021. This pattern speaks to the political, economic, and social entrenchment of mass incarceration.
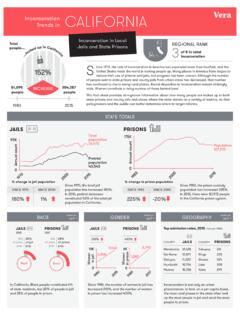
2 At the federal level, the number of People in civil custody for Immigration and Customs Enforcement (ICE) is less than one-third of the 2019 population, while the number of People detained for the Marshals Service (USMS) facing federal criminal charges reached an all-time high. jail populations in rural counties dropped by 27 percent from 2019 through March 2021, the most of any region. The historic drop in the number of People incarcerated was neither substantial nor sustained enough to be an adequate response to the pandemic, and incarceration in the United States remains a global aberration. Figure 1 The number of People incarcerated in jails and prisons from 1980 to Spring 2021 Recent evidence from the Bureau of Justice Statistics also shows that racial inequity worsened as jail populations declined through June Vera Institute of Justice (Vera) researchers collected data on the number of People incarcerated throughout 2020 and into early 2021 to provide timely information about how incarceration is changing in the United States during the COVID-19 Vera researchers estimated the incarcerated population using a sample of approximately 1,600 jail jurisdictions, 50 states, and the Federal Bureau of Prisons, the USMS, and ICE.
3 Figure 2 Summary of incarcerated populations and changes by region Midyear Spring 2019 to Spring 2021 Midyear 2020 to Spring 2021 2019 2020 2021 Change % Change Change % Change Total 2,115,000 1,816,300 1,774,900 -340,100-16-41,400-2 Prisons 1,435,500 1,309,500 1,193,900 -241,600-17-115,600-9 Jails 758,400 573,400 647,200 -111,200-1573,800 13 Urban 166,979 127,100 147,200 -19,779-1220,100 16 Suburban 146,976 116,800 132,600 -14,376-1015,800 14 Small/Midsize metro 260,169 208,400 232,800 -27,369-1124,400 12 Rural 184,295 121,200 134,500 -49,795-2713,300 11 0500 ,0001,000,0001,500,0002,000,0002,500,000 19801990200020102020 Summary Total incarceration State & federal prisons Local jails 2 Figure 2 note: Total incarceration numbers are adjusted downward slightly to avoid double counting People held in local jails under contract for state prisons.
4 See Methodology and Source Notes at Figure 1 source note: The 2019, 2020, and 2021 jail and Prison population estimates are based on data collected by Vera, while 1983 through 2018 estimates are from the Bureau of Justice Statistics (BJS) Census of Jails, Annual Survey of Jails, and National Prisoner Statistics. See generally BJS, Data Collection: Census of Jails, ; BJS, Data Collection: Annual Survey of Jails (ASJ), ; and BJS, Data Collection: National Prisoner Statistics (NPS) Program, The 1980 jail estimates are from the Census, see Margaret Werner Cahalan, Historical Corrections Statistics in the United States, 1850-1984 (Washington, DC: BJS, 1986), It has been more than a year since the first calls to release People from jails, prisons, and detention centers during the COVID-19 pandemic.
5 At the end of March 2021, there were nearly million People still incarcerated in the United States, down only 2 percent since June 2020 there was a 9 percent decrease in the Prison population, but that was offset by a 13 percent increase in the jail population. In the face of continued demands for change, most politicians and policymakers failed or refused to do more. Instead they have tolerated widespread COVID-19 outbreaks in jails and prisons across the United States. New data collected by Vera and detailed in this report reveals that, after the unprecedented drop in the total incarcerated population in the United States that occurred in the first half of 2020, the second half of 2020 looked different. Some places sustained their reduced incarcerated populations, and some even pushed for further reductions.
6 Other states, however, began incarcerating more People as states reopened and returned to previous practices. In early 2021, incarceration in the United States looks like a patchwork of big changes in the use of jail and Prison , varying from state to state and city to city. Some states are reducing Prison populations at the expense of refilling jails, as People sit behind bars waiting for court dates or transfers. Some states made less substantial changes in early 2020 but continued to reduce incarceration throughout the fall and winter even as other states returned to normal in ways that have increased incarceration. Generally, however, states that started 2020 with higher incarceration rates made fewer efforts to reduce incarceration or maintain their reductions through Spring 2021.
7 Widening racial disparities States and localities rarely publish data on incarceration by race, ethnicity, or gender. As a result, this report focuses on overall incarceration numbers. The Bureau of Justice Statistics (BJS) publishes annual reports that provide national estimates of the number of People in jail and Prison using data collected through the Annual Survey of Jails, Census of Jails, and National Prisoner Statistics data series. These reports provide statistics on jail populations, including more detailed breakdowns by race and gender. The most recent BJS report for jails, which provides 2020 data, was released in March 2021. The report for 2019 Prison data was released in October 2020, meaning it is too early to know whether racial disparities in Prison changed during the The BJS report on the 2020 jail population found that the national jail incarceration rate of Black People declined 22 percent between 2019 and 2020, while the jail incarceration rate of white People declined 28 The same report also found that incarceration rate of Latinx People had declined 23 percent and the jail incarceration rate of Asian American People had declined 21 These changes widened existing racial disparities in jail incarceration that see People of color targeted for incarceration at greater rates than white People .
8 The historic changes in Prison and jail populations triggered by the COVID-19 pandemic came during a national wave of global 3 demonstrations led by Black Lives Matter and accompanying demands to reckon with racism and police violence and fundamentally change the criminal legal system in the United As a result, there was far more pressure on officials in some states and counties to release People from Prison and jail in 2020 and 2021 than in prior years. This report In order to provide the public with timely information on how jail and Prison populations are changing due to the COVID-19 pandemic, Vera collected midyear 2020, fall 2020 (on or around September 30), end of 2020 (on or around December 31), and Spring 2021 (on or around March 31) jail and Prison population data directly from a sample of local jails, state oversight agencies, state Prison systems, and the Federal Bureau of Prisons (BOP).
9 Vera also collected data on People detained by ICE who were held in local jails, private prisons, and dedicated immigration detention This report focuses on the changes from June 2020 to March 2021, but additional data for September 2020 and December 2020 is available in a data file Vera s national Prison statistics are estimates based on data from 50 states and the BOP, which together held 95 percent of the People incarcerated in Prison in 2019 (jurisdictional data from Virginia and Wyoming was not available for Spring 2021 and was estimated). jail statistics are derived from a sample of about 1,600 jails. These include all county jails in 13 states and a sample of jails in the remaining states. Vera researchers used these counts to estimate the national total. The jails in Vera s sample held almost three out of every four People incarcerated in jails in 2013, which was the last time the BJS reported information for all jails in the United States.
10 All jail population counts in this report are estimates of the number of People in the custody of the local jail , not the number of People in the local jail s jurisdiction. (See Methodology and Source Notes for a definition of these terms and a detailed description of Vera s methods.) Prison population counts in this report are estimates of the number of People under the jurisdiction of state and federal Prison systems and, thus, include People held in private prisons or local jails on a contract basis as well as People held in work-release and medical facilities who are not free to leave and are still serving a Prison sentence. Generally, Vera obtained data from the official websites of local jails and state corrections departments or from third parties that have been collecting data directly from jails.