Transcription of Performance and Optimization Examples: Centrifugal …
1 Optimization example 2009 Beta Machinery Analysis 1 Performance and Optimization Examples: Centrifugal compressor As part of our monitoring and field services, BETA can assist with Performance assessments for rotating equipment such as gas turbine/ Centrifugal compressor trains. 1. Centrifugal Performance Assessment: Changing Operating Conditions A gas plant was planning to increase the inlet gas supply volume. BETA was retained to evaluate the compressor and gas turbine Performance to determine whether the unit could handle a 35% increase in gas throughput. As discussed, below, the issue becomes complex due to the impact of ambient temperatures.
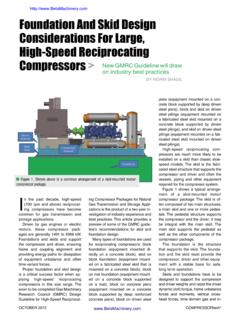
2 Historical and current operating data were used in BETA s Performance model to predict throughput and power requirements. It was found that the available engine power could handle the additional volume at certain operating conditions and not at others. The key variables in the analysis were suction pressure and ambient temperatures. As shown, below, there is a gap between required power (for the compressor ) and available power. The graph shows compressor input power vs. suction pressure for three different ambient temperatures. At higher suction pressures and low ambient temperatures, the unit can handle the increased throughput (power output exceeds the required power.)
3 For example , at 15 C operation is possible above a suction pressure of 2550 kPa, in the area highlighted below (oval area). At lower suction pressures there is insufficient power for the required load. This is illustrated by the gap between required power and compressor power output (see example at 15 C and 2200 kPa). These results were used to investigate various power upgrade possibilities for the gas turbine an ongoing analysis. kPa Power vs. Suction PressureDischarge pressure = 6200 kPaFlow = 5700 E3M3/D60 80 100 120 140 160 1600 1800 2000 2200240026002800 3000 Suction pressure (kPa)Power output (% of rated) Required Power (@15 C gas temp)Avail.
4 Power (Ambient temp -7 C)Avail. Power (Ambient temp 15 CAvail. Power (Ambient temp 30 C) example : Performance Gap at 15C and 2200 kPa (Available Power < Required Power) Gap Optimization example - Centrifugal compressor 2009 Beta Machinery Analysis 2 2. Should Turbo Expander Be Rebuilt? (Turbo Expander and Centrifugal compressor example ) For this midstream company, the customer was unsure if the turbo expander should be rebuilt. Would the improved Performance (and economics) support the associated repair cost? The process involves a turbo expander that compresses low pressure gas, which then feeds the Centrifugal compressor .)
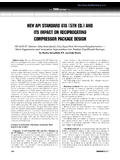
5 The turbo expander currently has a discharge pressure of 2100 kPa. A major overhaul of the turbo expander would increase the discharge pressure to 2460 kPa (the suction pressure for the Centrifugal compressor ). The benefit of this higher suction pressure is to reduce the load on the Centrifugal compressor decreasing fuel requirements. The cost for this overhaul is $150,000. BETA predicted the reduced power requirements and reduced fuel consumption, and evaluated the economics, using an assumed fuel cost of $5/MCF. As shown, below, the overhaul would payout in 65 to 87 days a very good investment. On the basis of these findings, the overhaul is being carried out.
6 This table shows the Centrifugal compressor Performance results, including fuel savings ($) for the typical discharge pressure (Pd), two flow rates (Q) before and after the change in suction pressures (Ps). Q= 4250 e^3m^3/dQ= 5700 e^3m^3/dBefore overhaul: Power (Bhp) at Ps = 2100 kPa:1164015611 After overhaul: Power (Bhp) at Ps = 2460 kPa:979513136 Power Savings from overhaul (Bhp) Savings (MSCF/day) Savings: ($/day):$1, $2, Savings ($/year):$627, $842, on Investment (days):8765Pd = 6200 kPa Optimization example - Centrifugal compressor 2009 Beta Machinery Analysis 3 3. Centrifugal compressor Performance Degradation Centrifugal compressor Performance is evaluated against the wheel curve baseline for this particular unit.
7 As shown below, this unit had an 11% deviation in head at the point shown, likely due to impellor fouling, impellor wear, and/or increased clearances. BETA monitors the compressor s Performance to detect changes in Performance . The wheel curve is one of our analytical tools that is tracked regularly. Cash Flow Impact of Performance Deviation is about $142,500/year. This is based on 63 MMSCFD throughput and 325 BHP of extra power is required because of the stage Performance degradation (measured as head deviation). Fuel gas costs are based on engine BSFC of 10,000 BTU/BHP-hr and fuel gas valued at $5/MCF. Optimization example - Centrifugal compressor 2009 Beta Machinery Analysis 4 4.
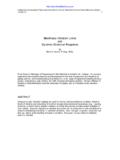
8 Gas Turbine: Impact of Improved Blade Wash Turbine blade wash is a required maintenance activity. However, the operator will realize improved cash flow by optimizing the maintenance cycle for blade washing. Avoiding unnecessary blade washing improves capacity throughput, yet excessive delays will result in pressure deviation (lower Performance ). BETA s monitoring identifies optimal maintenance cycles. Operating data from the turbine is collected daily and converted into normalized baseline curves (see figure at right). This baseline consists of normalized gas producer speed (horizontal) versus normalized compressor pressure deviation.
9 Deviations between current operating condition and the baseline curves are trended (see figure below). The pressure and temperature deviation is used to determine the optimal maintenance interval. The figure below illustrates multiple blade washing activities. In each case the pressure and temperature is reduced. The deviation starts to increase until the next wash cycle. Impact: Avoiding an unnecessary blade wash will result in reduced downtime and operating costs. The preserved production can represent hundreds of thousands of dollars in cash flow. On the other hand, decreased compressor efficiency causes increased fuel consumption and the resulting increased T5 temperatures can shorten component life.
10 These factors also represent very large economic impacts. 80100800900100011001200130014001500* SPEED - CORRECTED (%) PCD - CORRECTEDRun Hours Temperature Deviation (%) Pressure Deviation (%) Blade Wash: Maintenance ActivityLog Date (2 year period) Optimization example - Centrifugal compressor 2009 Beta Machinery Analysis 5 5. Gas Turbine: Performance Monitoring (Identifies $250,000 per Year Cost Saving) compressor discharge pressure (PCD) is a key factor in gas turbine Performance . Beta s MAO service determines the deviation in PCD from a baseline relationship with gas producer speed, N1. In the case shown here, PCD looks unremarkable, but the deviation in PCD tends to be jump between -7% and -3%.