Transcription of Photoluminescence Spectroscopy
1 Valence bandexcited statesconduction bandexcitation photonluminescence photonnonradiative relaxationband gap energyelectronsPhotoluminescence SpectroscopyPhysics U600, Adv Lab I Physics of Waves and Optics Summer 2004D. Heiman, Northeastern University, 6/1/2004I. IntroductionIn this experiment, the energy levels in a semiconductor quantum well structure are investigated usingthe technique of Photoluminescence (PL). A laser is used to photoexcite electrons in a GaAssemiconductor and when they spontaneously de-excite they emit luminescence. The luminescence isanalyzed with a spectrometer and the peaks in the spectra represent a direct measure of the energy levelsin the is a popular and useful semiconductor material. The importance of electronic devices using GaAsis second only to devices using the more ubiquitous semiconductor, Si.
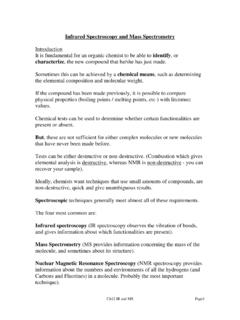
2 Since GaAs has a higher electronmobility than Si, it is used for higher-speed electronics. Cell phones use GaAs power amplifiers forgenerating the output signal at GHz, and GHz frequencies. In addition, GaAs has a so-called direct band-gap, unlike Si which has an indirect band-gap. This results in a strong interaction withlight which makes it useful for generating light in LEDs (light emitting diodes) and laser diodes. Alloyof GaAs, especially with Al and In, are used exclusively for sources in optical solids, including semiconductors, have so-called energy gaps for the conducting electrons. In order tounderstand the concept of a gap in energy, first considerthat some of the electrons in a solid are not firmly attachedto the atoms, as they are for single atoms, but can hop fromone atom to another.
3 These loosely attached electrons arebound in the solid by differing amounts and thus have manydifferent energies. Electrons having energies above acertain value are referred to as conduction electrons, whileelectrons having energies below a certain value are referredto as valence electrons. This is shown in the diagram wherethey are labeled as conduction and valence bands. Theword band is used because the electrons have a multiplicityof energies in either band.* Furthermore, there is an energygap between the conduction and valence electron normal conditions electrons are forbidden to haveenergies between the valence and conduction a light particle (photon) has an energy greater than the band gap energy, then it can be absorbed andthereby raise an electron from the valence band up to the conduction band across the forbidden energygap.
4 (See diagram.) In this process of photoexcitation, the electron generally has excess energy whichit loses before coming to rest at the lowest energy in the conduction band. At this point the electroneventually falls back down to the valence band. As it falls down, the energy it loses is converted backinto a luminescent photon which is emitted from the material. Thus the energy of the emitted photon isa direct measure of the band gap energy, Eg. The process of photon excitation followed by photonemission is called Photoluminescence .* Electrons which are mobile in a solid possess kinetic energy which varies with their velocity ( mv2). Thus, because of theirmotion they have a multiplicity of energies and is referred to as a band of energies. CAUTION Never look directly into any laser , make sure there are no reflections that direct the laser beam into your green laser has a power of approximately 5 mW.
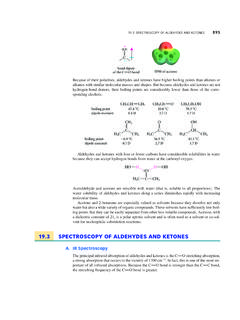
5 Compare this to the 1 mW of sunlight thatwould enter your 1mm diameter pupil if you looked directly at the experiment also introduces the widely used tool the spectrometer for optical Spectroscopy . Aspectrometer is a instrument used for measuring the intensity of light as a function of usually contain a diffraction grating (or prism) to disperse the light, thereby spreading outthe light of differing wavelengths into different positions. The spectrometer unit used here has aninternal CCD (charged coupled device) silicon detector, essentially a digital camera detector, to measurethe light intensity at various positions along its length. In the figure:light from an optical fiber enters at position #1;reflects off the collimating mirror #4;is diffracted by the grating #5;reflects from focusing mirror #6.
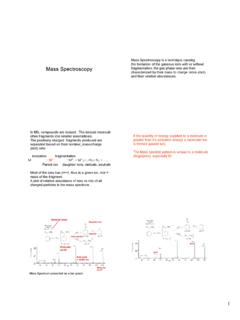
6 Then finally is read out by the CCD detector # more information on Ocean Optics spectrometers see their website, Apparatusaluminum breadboard with 1/4-20 tapped holesgreen laser diode, 5 mW @ 530 nmUSB2000-FLG Ocean Optics spectrometer/detector, USB cableOOIBase32 softwarelens, 25 mm focal length, for collecting and focusing fluorescencemirror, in x-y adjustable mountneutral-density (ND) optical filter (black)long-pass optical filter (yellow)optical fibers, 50 and 600 micron coresGaAs/GaAlAs sample mounted on holder GreenDiode Laser Adjustable MirrorCollection Lens RubySamplePhotodiodeBeam StopOptical FiberNeutral-density Filter USB2000 SpectrometerFO InputLong-pass FilterIII. ProceduresA. Room Light SpectrumHere, you will measure the spectrum of fluorescent light in the room in order to determine the gases inthe tubes.
7 Insert one end of the 600 micron core fiber optic (FO) into the spectrometer input and theother end pointing at the wall to collect stray room light. Plug in the USB cable and start the the collection (integration) time so that the highest spectral peak is near but not above saturationat 4000 counts. You should see many spectral lines from the excited gases in the fluorescent the spectrum and include in is the characteristic linewidth (full-width at half-maximum) of the narrowest spectral line?Replace the 600 micron FO with the 50 micron FO. What is the narrowest linewidth? and list in table form the intensities of the 5 or 6 strongest lines in counts per the measured wavelengths and identify the element by their corresponding wavelength.#. Optical SetupMount the optical components on the breadboard approximately as shown in the diagram andphotograph.
8 Before beginning, confirm that the black neutral-density (ND) filter is in front of thelaser. Adjust the center of all components to a common height to within a few the laser beam onto the small sample of a beam stop to keep the reflected beam from leaving the Alignment Next, the collection optics must be aligned. Using the lens maker s formula, computethe image and object distances for the f=25 mm focal length collection lens and place the lensaccordingly. Insert one end of the 600 micron FO into the mount that points at the collection lens, andthen shine a white light source into the other end. While holding a white piece of paper at the front ofthe small GaAs crystal, adjust the position of the lens and FO so that the white spot image is focused atthe front face of the crystal. Now adjust the mirror to overlap the green laser beam and the white spotimage on the crystal.
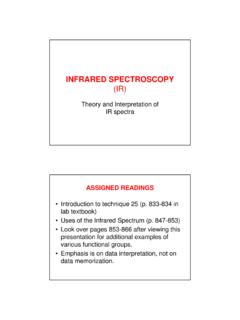
9 Cover the breadboard with the black cloth to block the room Alignment Maximize the PL spectral peak from the GaAs by adjusting the wellconduction bandvalence bandbarrierbarrierGaAlAsGaAlAsGaAsenergy C. Pure GaAsInsert the 50 :m core FO and make fine adjustments to maximize the and store the PL spectrum from the pure GaAs sample (small top piece).What is the wavelength of the spectral peak and full-width at half-maximum (FWHM) linewidth?Plot PL intensity versus photon energy in energy units of eV (transform x-axis).Compute and record the peak position, Eo, and FWHM, (, in GaAs Quantum WellMove the sample holder in order to collect PL from the quantum well sample (small lower sample).Collect and store the PL spectrum for the GaAs quantum is the wavelength and FWHM of the spectral peak?Plot PL intensity versus photon energy in energy units of eV (transform x-axis).)
10 Compute and record the peak position, E1, and FWHM, (, in E1 to Eg+)E (use Eg= eV).Compute the well width and uncertainty. diagram on the right shows a quantum wellstructure made of layers of GaAs and the (or abbreviated GaAlAs). Addingaluminum to GaAs increases the bandgap. Forsimplicity it is shown with all the energy increase inthe conduction band. Thus in this sandwich ofmaterials, GaAs forms a well of lower energy withGaAlAs barriers on either side. If the well issufficiently narrow then the conduction band iseffectively pushed up to the double line and this isreferred to as quantum confinement. The confinementenergy is denoted as )E, which is equal to the energyincrease. Now, electrons which are confined in thewell have an energy Eg+)E above the valence new energy is seen as a shift in energy of the PLspectral peak to higher photon energies.