Transcription of Spectrometry: Absorbance of Visible Light by a …
1 CHEMICAL, ENVIRONMENTAL, AND BIOTECHNOLOGY DEPARTMENT spectrometry : Absorbance of Visible Light by a Food Colour Dye by Professor David Cash September, 2008 Mohawk College is the author and owner of these materials (excluding copyright held by others) and all copyright and intellectual property rights contained therein. Use of these materials for teaching or other non-commercial purposes is allowed. Contact information for Mohawk College will be found on the following page. This Experiment is a 2 hour General Chemistry laboratory exercise. It is designed for students in the common first term of a 2-year diploma program (Biotechnology, Environmental, or Health Technician).
2 For Information or Assistance Contact: MOHAWK COLLEGE CHEMICAL, ENVIRONMENTAL, AND BIOTECHNOLOGY DEPARTMENT Professor Cindy Mehlenbacher 905-575-1212 ext. 3122 Bill Rolfe (Chief Technologist) 905-575-2234 1 Experiment 10 spectrometry : Absorbance of Visible Light by a Food Colour Dye OBJECTIVE Calibration standard solutions of the red food colour dye Allura Red (Red 40) will be prepared from a supplied stock solution by serial and multiple dilutions. The Visible Light Absorbance of each of the prepared calibration solutions will be measured.
3 From the Absorbance values of the prepared calibration solutions a calibration line of Absorbance against concentration will be constructed. The Absorbance of one or more supplied unknown solutions containing Allura Red will be measured. From the experimental Absorbance values of the unknown solutions, the concentration of the dye in each unknown solution will be determined using the calibration line. A working solution of Allura Red will be prepared from the stock solution by simple dilution. A set of calibration standard solutions of Allura Red will be prepared from the working solution by multiple dilution.
4 The concentration of Allura Red in each solution prepared will be calculated in ppm units. The percent transmission of Light at 504 nm wavelength of the calibration standard solutions of Allura Red will be measured using a Spectronic 20 instrument. The Absorbance of each calibration standard solutions of Allura Red will be calculated. A plot of Absorbance against concentration for Allura Red will be constructed. A linear trendline will be added to the plot. The concentration of one or more solutions containing unknown amounts of Allura Red will be determined experimentally by the use of the trendline equation.
5 The amount of Allura Red in specified portions of the unknowns will be determined. REFERENCES General Information Section of This Manual Page Dilution Error! Bookmark not defined. Wikipedia URL Food Colours Brilliant Blue Allura Red Spectronic 20 Beer-Lambert Law 2 INTRODUCTION Food Colour Dyes According to Pavia, Lampman, and Kriz1, there were more than 90 dyes regularly used in foods prior to 1906, many of them also used as textile dyes. As scientific knowledge of the hazards has become more precise and government safety regulation more stringent, the number of allowed food dyes has been gradually decreased.
6 In 1938, the number of food dyes allowed in the was 15, and in 1950 it was 19. At the present time (2008), there are 7 FD&C (food, drug, and cosmetic) dyes allowed for food use in the The same 7 and one other dye are allowed for food use in Canada. Some other dyes are also allowed in some other countries around the world. The eight food dyes allowed in Canada are distributed by Calico Food Ingredients2 Ltd. of Kingston, Ontario in the form of solid powders or as 5 % solutions in water. A food dye must absorb Visible Light .
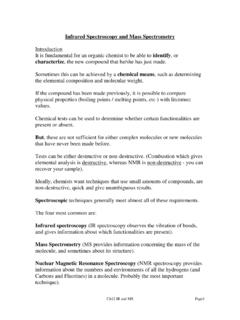
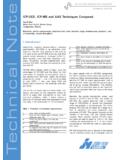
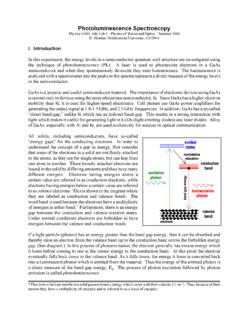
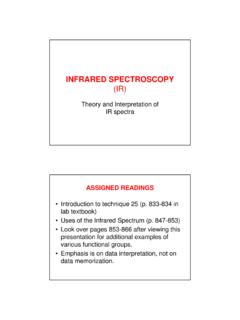
7 The Visible range spectra of some food dyes, including Allura Red (Red 40) and Brilliant Blue (Blue 1) are shown on page 3. The chemical structures of the two dyes are shown in the Table on page 4. The wavelength of maximum Absorbance (?max) for Red 40 is taken to be at 504 nm. The substance absorbs BLUE Light and appears RED to the human eye. Quantitative spectrometry Lambert ( 1760) and Beer ( 1850) determined that the transmission of Light energy through a solution of an absorbing substance was dependent on the path length and the concentration of the absorbing substance by a logarithmic relationship, as shown: P0 PDefinitions and Terms:Transmittance = T =PP0PP0 Percent T = % T = 100 %b = the Path Lengthc = the ConcentrationBeer - Lambert Law(Beer's Law).
8 A = abca = the 'Constant'A = the AbsorbanceP0 = the Incident IntensityP = the Emergent IntensityAbsorbance = A = - log T = logP0P100% T= log This relationship is now called the Beer Lambert Law or Beer s Law. Most quantitative methods using Beer s Law are based on the premise that a plot of Absorbance (A) against concentration of the analyte is linear in the region of use. This must be proven for a new method, and should be verified for an analysis that is unfamiliar. When a linear plot has been prepared (called a calibration line), it may be used to determine the concentration of the analyte in an unknown solution.
9 This process will be demonstrated in this experiment. 1 Pavia, Lampman, and Kriz, Introduction to Organic Laboratory Techniques, 3rd Edition, Saunders, pages 269-273. 2 See 3 Visible Absorption Spectra of Some Food Dyes ~chemlab/chem6/dyes/full_ Retrieved 2008 02 15 ~chemlab/chem6/dyes/full_ Retrieved 2008 02 15 4 Chemical Structures of Red 40 and Blue 1 Name (Colour) Chemical Structure Allura Red AC or FD&C Red 40 (Red) SOOONNaNHOSOOONaOCH3CH3 Brilliant Blue FCF or FD&C Blue 1 (Blue) NCH2C2H5 NCH2C2H5SO3 NaSO3 NaSO3 5 The Calibration Line Method There are many chemical and physical systems used in analysis, where some measured property is directly proportional to the concentration of a certain substance.
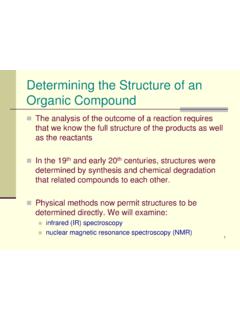
10 In such cases, a Linear Trendline or Calibration Line method may be utilized, as in this experiment. The example below is taken from Bender3. This is an analytical calibration line (a linear trendline) for an analytical measurement due to the presence of Carbamazepine, an anticonvulsant prescription drug. The plot and the trendline were developed by using calibration standard solutions of Carbamazepine of known concentration, represented by the plotted data points. The analytical measurements were made using a High Performance Liquid Chromatograph (HPLC) instrument.