Example: stock market
PointFlow: 3D Point Cloud Generation With Continuous ...
of distributions. Specifically, we learn a two-level hier-archy of distributions where the first level is the distribu-tion of shapes and the second level is the distribution of points given a shape. This formulation allows us to both sample shapes and sample an arbitrary number of points from a shape. Our generative model, named PointFlow,
Tags:
Information
Domain:
Source:
Link to this page:
Documents from same domain
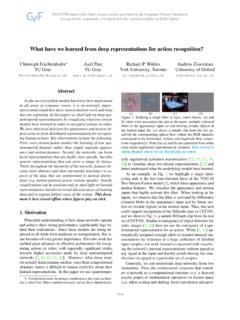
What Have We Learned From Deep Representations for …
openaccess.thecvf.comwhat these powerful models actually have learned. In this paper we shed light on deep spatiotemporal net-works by visualizing what excites the learned models us-ing activation maximization by backpropagating on the in-put. We are the first to visualize the hierarchical features
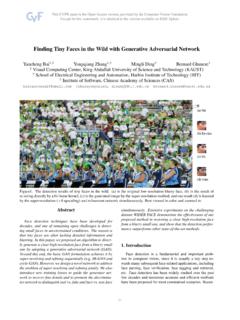
Finding Tiny Faces in the Wild With Generative Adversarial ...
openaccess.thecvf.comfaces, which are unfriendly for the face classifier. Toward-s this end, we design a refinement sub-network to recover some detailed information. In the discriminator network, the basic GAN [17, 12, 8] is trained to distinguish the real and fake high resolution images. To classify faces or non-
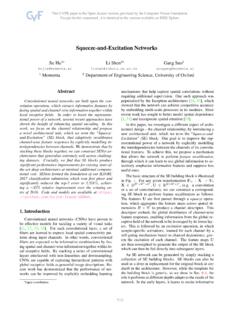
Squeeze-and-Excitation Networks - openaccess.thecvf.com
openaccess.thecvf.comSqueeze-and-Excitation Networks Jie Hu1∗ Li Shen2∗ Gang Sun1 hujie@momenta.ai lishen@robots.ox.ac.uk sungang@momenta.ai 1 Momenta 2 Department of Engineering Science, University of Oxford Abstract Convolutional neural networks are built upon the con-
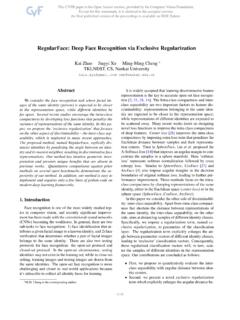
RegularFace: Deep Face Recognition via Exclusive ...
openaccess.thecvf.comRegularFace: Deep Face Recognition via Exclusive Regularization Kai Zhao Jingyi Xu Ming-Ming Cheng ∗ TKLNDST, CS, Nankai University kaiz.xyz@gmail.com cmm@nankai.edu.cn
Protecting World Leaders Against Deep Fakes
openaccess.thecvf.comProtecting World Leaders Against Deep Fakes Shruti Agarwal and Hany Farid University of California, Berkeley Berkeley CA, USA {shrutiagarwal, hfarid}@berkeley.edu
Auto-DeepLab: Hierarchical Neural Architecture Search for ...
openaccess.thecvf.comAuto-DeepLab: Hierarchical Neural Architecture Search for Semantic Image Segmentation Chenxi Liu1∗, Liang-Chieh Chen 2, Florian Schroff2, Hartwig Adam2, Wei Hua2, Alan Yuille1, Li Fei-Fei3 1Johns Hopkins University 2Google 3Stanford University Abstract Recently, NeuralArchitectureSearch(NAS)hassuccess-
PointNet: Deep Learning on Point Sets ... - CVF Open Access
openaccess.thecvf.comPointNet: Deep Learning on Point Sets for 3D Classification and Segmentation Charles R. Qi* Hao Su* Kaichun Mo Leonidas J. Guibas Stanford University
Frustum PointNets for 3D Object Detection From RGB-D Data
openaccess.thecvf.comFrustum PointNets for 3D Object Detection from RGB-D Data Charles R. Qi1∗ Wei Liu2 Chenxia Wu2 Hao Su3 Leonidas J. Guibas1 1Stanford University 2Nuro, Inc. 3UC San Diego Abstract In this work, we study 3D object detection from RGB-D data in both indoor and outdoor scenes.
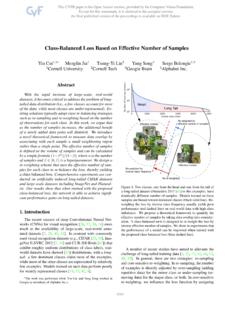
Class-Balanced Loss Based on Effective Number of Samples
openaccess.thecvf.comand large-scale datasets including ImageNet and iNatural-ist. Our results show that when trained with the proposed class-balanced loss, the network is able to achieve signifi-cant performance gains on long-tailed datasets. 1. Introduction The recent success of deep Convolutional Neural Net-works (CNNs) for visual recognition [26, 37, 38, 16] owes
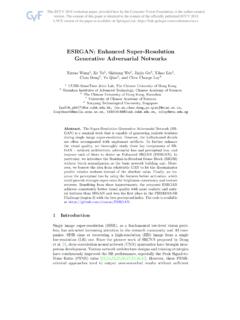
ESRGAN: Enhanced Super-Resolution Generative Adversarial ...
openaccess.thecvf.comESRGAN: EnhancedSuper-Resolution Generative Adversarial Networks Xintao Wang 1, Ke Yu , Shixiang Wu2, Jinjin Gu3, Yihao Liu4, Chao Dong 2, Yu Qiao , and Chen Change Loy5 1 CUHK-SenseTime Joint Lab, The Chinese University of Hong Kong 2 Shenzhen Institutes of Advanced Technology, Chinese Academy of Sciences 3 The Chinese University of Hong Kong, …
Related documents

4.2 Shapes of Distributions - University of Iowa
homepage.stat.uiowa.edu1 4.2 Shapes of Distributions ! Symmetry " Symmetrical or asymmetrical " If symmetrical, mounded or flat? Skew " Right, left Peaks or Modes " Unimodal, bimodal, multiple peaks Spread " Narrow spread or wide spread
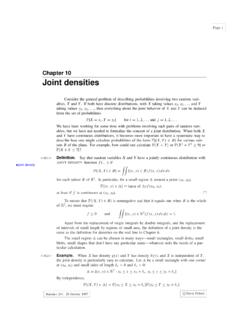
Chapter 10 Joint densities - Yale University
www.stat.yale.eduand Y have continuous distributions, it becomes more important to have a systematic way to describe how one might calculate probabilities of the form Pf.X;Y/2Bgfor various sub- ... blobs, small shapes that don’t have any particular name—whatever suits the needs of a par-ticular calculation. <10.2> Example.

AP Statistics 2008 Scoring Guidelines - College Board
secure-media.collegeboard.orgThe shapes of the two distributions differ. The distribution of sugar content for three-quarter-cup cereals is reasonably symmetric: notice that the median is in the middle of the box. The distribution of sugar content for one-cup cereals is clearly skewed to …
Fitting distributions with R
cran.r-project.orgFitting distributions with R 8 3 ( ) 4 1 4 2--= = s m g n x n i i isP ea r o n'ku tcf . According to the value of K, obtained by available data, we have a particular kind of function. Here are some examples of continuous and discrete distributions6, they will be used afterwards in this paper.

Describing Distributions - With Graphs or Tables
faculty.washington.edu4.2 How to Make A Histogram How many hours per week (h) will you study for STAT 220? quantitative Hours Count Proportion 0 h < 2 3 0.03 2 h < 4 15 0.17 4 h < 6 26 0.29 6 h < 8 14 0.15 8 h < 10 9 0.10 10 h < 12 15 0.17 12 h < 14 3 0.03 14 h …

AP Statistics 2011 Scoring Guidelines Form B - College Board
secure-media.collegeboard.org12–13 1 2 13–14 14 5+= 24 6+= 14–15 14 6 11++= 24 4 10++= 15–16 14 6 3 14+++= 24 4 11 21+++ = Thus, the median P-T ratio for both groups is at least 15 students per teacher and at most 16 students per teacher. Part (b): The shapes of the two histograms are different. The histogram for states that are west of the

Chapter 4, Estimating Density: Quadrat Counts
www.zoology.ubc.cahighest statistical precision for a given total area sampled, or for a given total amount of time or money, (2) ecologically, as that quadrat size and shape that are most efficient to answer the question being asked, and (3) logistically, as that quadrat size and shape that are easiest to put out and use. You should be wary of the logistical criterion since in