Transcription of Power Amplifiers for Communications
1 Berkeley Power Amplifiers for Communications Prof. Ali M. Niknejad Berkeley Copyright c 2014 by Ali M. Niknejad Niknejad Advanced IC's for Comm PA System Level Specifications Niknejad Advanced IC's for Comm Power Amplifier Specifications Peak Output Power Efficiency Pdc Power Gain Zout != 50 . Amplifier Linearity Pin PL. Stability over VSWR. Ability to transmit into an unknown/varying load Heat Power Control Zin = 50 . Step size, range high efficiency at back-off Niknejad Advanced IC's for Comm Peak Output Power The peak output Power determines the range for two-way Communications . When we hit sensitivity limits, the only way to increase the range is to increase the Tx Power .
2 The peak Power is specified at the 1-dB compression point or the maximum output Power the clipping point (makes a big difference). 1W for cellular handsets ( 1 km distance). 100mW for W-LAN (100 m). 10mW for W-PAN (Bluetooth) (1-10 m). 1mW for body area networks. In practice, the average Power transmitted may be much lower than the peak output Power due to back-off , to obtain linearity for the amplitude modulation (fast time scale) or for Power control (slow time scale). Niknejad Advanced IC's for Comm Peak Efficiency Power Added Efficiency (PAE) is a popular metric. Pout is the output Power , Pin is the input Power , and Pdc is the DC Power consumption of the PA.
3 For high Power gain systems (Gp ), the efficiency Pout Pin approaches the drain PAE =. Pdc drain efficiency ( d ), or for a BJT, the collector Pout Pout . efficiency, or simply the efficiency of the last stage PAE =. Gp Pdc The efficiency of the PA is an important measure of Pout the battery life of the wireless transceiver. Since the = (1 Gp 1 ). Pdc PA Power dwarfs the Power consumption in the PAE = c (1 Gp 1 ). receiver, it is usually the most important c specifications. For lower Power systems (below 10mW), the Power of the entire transmitter chain is important and should be taken into consideration. Niknejad Advanced IC's for Comm Average Efficiency with Power Control For a constant envelope signal (phase/frequency modulation), the average efficiency is equal to the average efficiency at peak Power .
4 Due to Power control, though, we must take into account the statistics of the transmitted signal. Modern systems use Power control to minimize the impact of a transmitter on nearby systems (interference) and hence only use as much Power as needed to achieve low error communication with the base station. Thus the actual average efficiency depends on how the efficiency varies with output Power Niknejad Advanced IC's for Comm Power Statistics Z . av = (P)g (p)dP.. Given the distribution of Power levels, or the PDF g (P), we can calculate the expected value of the efficiency Unfortunately, for most PAs the efficiency drops at low Power .
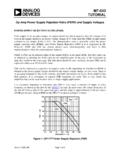
5 Niknejad Advanced IC's for Comm Envelope Statistics For signals with amplitude modulation, the average efficiency depends not only on the desired Power level, but also on the statistics of the envelope. The amount of Power variation is usually captured by the PAR, or the Peak-to-Average Radio. The PAR is a strong function of the type of modulation. Systems with the highest PAR are OFDM systems employing multiple carriers. Niknejad Advanced IC's for Comm Linearity dB. transmit filter mask IM3 HD2. IM5 HD3. f f1 f2 2f1 2f2. 2f1-f2 2f2-f1. 3f1-2f2 3f2-2f1. The traditional way to characterize narrowband system linearity is with IM3.
6 Since the system may be driven into a strongly non-linear regime, all odd order harmonics should be carefully taken into account to ensure that excessive spectral leakage does not occur. Niknejad Advanced IC's for Comm Sources of Non-Linearity PAs exhibit nonlinear distortion in amplitude and phase. For a mulated signal, both sources of distortion are significant. The dominant sources are AM-to-AM and AM-to-PM. Amplitude distortion: AM-to-AM conversion Phase distortion: AM-to-PM conversion For input: x(t) = A(t) cos( t + (t)). Corresponding output: y (t) = g [A(t)] cos( t + (t) + [A(t)]). AM-to-AM conversion dominated by gm non-linearity before clipping AM-to-PM conversion dominated by non-linear capacitors (phase delay).
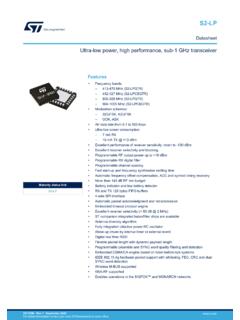
7 Niknejad Advanced IC's for Comm AM-AM and AM-PM Non-Linearity For a narrowband signal, we can partition the non-linearity into an amplitude-amplitude (AM-AM) component and an amplitude-phase (AM-PM) component This behavioral model can be used to run system level simulations to see the effect of non-linearity on a modulated waveform Niknejad Advanced IC's for Comm Adjacent Channel Power (ACP). P1. P2. 30 kHz 885kHz ACP=P1(dBm)-P2(dBm). For modern communication systems, the IM specifications leave a lot to be desired since they are only based on two-tone excitation. Increasingly, the actual modulation waveform needs to be tested with the PA.
8 To ensure proper etiquette, the amount of Power leaking into an adjacent channel is carefully specified. Niknejad Advanced IC's for Comm Unwanted emissions are caused by a number of factors including non-linearity in the Chapter 2 Transmitter Fundamentals 28. Transmit Mask Specs system, noise resulting from interference with other circuits or spurious tones created by mask. Non-idealities in the transmitter, which distort the signal, will bring the modulated clocks or frequency synthesizers. Because these non-idealities affect the in-band signal signal higher and thus closer to violating the spectral mask. These non-idealities will be they can also have an effect on the modulation accuracy.
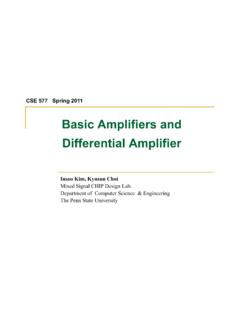
9 The in-band spectral mask requirement for DCS1800 is illustrated in Figure discussed in more detail in the following section. 10. 0. 0. -10. Relative Power (dBc). -20 -20. -30. PSD. -40. -40. -50. -60. -70 -60. -80. 0 1 2 3 4 5 6 7. -400 -200 0 200 400. Frequency O ffset (MH z) Frequency (KHz). Figure GSM in-band spectral mask requirement. Figure GSM spectral mask at low offset frequencies with GMSK modulated signal. Every standard therefore has a transmit mask specification Typically, one of the most difficult portions of the spectral mask requirement is In addition to in-band requirements, out-of-band spectral emissions requirements that must be met.
10 This limits spectral regrowth, noise, and close to the carrier at. For example, Figure shows the same GSM spectral mask at also have an affect on transmitter design. While the out-of-band emissions don't affect relatively low offset frequencies. In addition a GMSK modulated signal has also been other spurious transmissions in the band and in nearby bands. the modulation accuracy or other transmitters in the same band, the limits are often lower illustrated in the same plot. Notice that the modulated signal is always below the spectral than the in-band limits, making them more difficult to satisfy. For example, one of the Above examples are for GSM.