Transcription of Practice Exam Questions; Statistics 301; Professor Wardrop
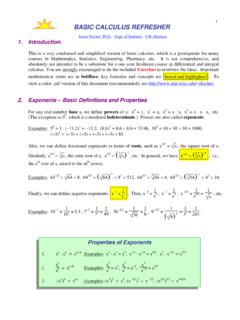
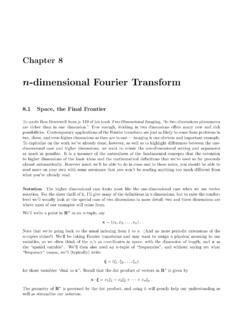
1 Practice Exam Questions; Statistics 301; Professor WardropChapters 1, 12, 2, and 31. Measurements are collected from 100 subjects from each of two sources. The datayield the following frequency histograms. The number above each rectangle is its 11 1234578910112345789105678910111213141516 1718 Source 215132116814568 Each sample has the same mean, In order to answer (b) and (c) below, refer to the empiricalrule for interpretings, taking into account the shape of the histogram. Do not try to calculatesbecause you do not have enough information to do so. In addition, you will receive no credit forsimply identifying the corrects; you must provide an explanation.
2 (a) What is the most precise correct state-ment that you can make about the numer-ical value of the median of the data fromsource 2?Do not explain your : Here is a correct statement: The me-dian is between 0 and 20. This statementis not precise enough to receive any credit.(b) Among the possibilities , , which is the numerical value ofsforthe data from source 1?Explain your an-swer.(c) Among the possibilities , , which is the numerical value ofsforthe data from source 2?Explain your The mean and median of Al sn= 3observa-tions both equal 10.
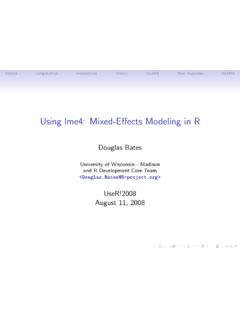
3 The mean and median ofBev sn= 5observations both equal 18.(a) Carol combines Al s and Bev s data intoone collection ofn= the mean of Carol s data be calculatedfrom the information given? If you thinknot, just say that. If you think it can, thencalculate Carol s mean.(b) Refer to part (a). Demonstrate, by an ex-plicit example, that there is not enoughinformation to determine Carol s : Find two sets of data sets that sat-isfy Al s and Bev s conditions, yet, whencombined, give different A sample of size 40 yields the following sorteddata. Note that I have x-ed outx(39)(the sec-ond largest number).
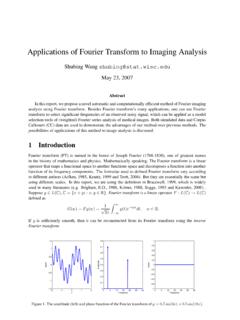
4 This fact will NOT pre-vent you from answering the questions (a) Calculate range, IQR, and median of thesedata.(b) Given that the mean of these data (exactly) and the standard devia-tion is , what proportion of the datalie within one standard deviation of themean?(c) How does your answer to (b) compare tothe empirical rule approximation?(d) Ralph decides to delete the smallest obser-vation, , from these data. Thus, Ralphhas a data set withn= 39. Calculate therange, IQR, and median of Ralph s newdata set.(e) Refer to (d).Calculate the mean ofRalph s new data Sarah performs a CRD with a dichotomous re-sponse and obtains the following , she obtains the sampling distribution ofthe test statistic for Fisher s test for her data; itis given (X=x)P(X x)P(X x) (a) Find the P-value for the first alternative(p1>p2) ifa= 6.
5 (b) Find the P-value for the third alternative(p16=p2) ifx= (c) Determineboththe P-value andxthat sat-isfy the following condition: The data arestatistically significant but not highly sta-tistically significant for the second alter-native (p1<p2).5. Sarah performs a CRD with a dichotomous re-sponse and obtains the following , she obtains the sampling distribution ofthe test statistic for Fisher s test for her data; itis given (X=x)P(X x)P(X x) (a) Find the P-value for the first alternative(p1>p2) ifa= (b) Find the P-value for the third alternative(p16=p2) ifx= (c) Determineboththe P-value andxthat sat-isfy the following condition: The data arestatistically significant but not highly sta-tistically significant for the second alter-native (p1<p2).
6 6. Consider a balanced study with six subjects,identified as A, B, C, D, E and G. In the actualstudy, Subjects A, B and C are assigned to thefirst treatment, and the other subjects areassigned to the second treatment. There are exactly four successes, obtainedby A, D, E and information is needed for parts (a) (c) be-low.(a) Compute the observed value of the teststatistic.(b) Assume that the Skeptic is correct. Deter-mine the observed value of the test statis-tic for the assignment that places C, D andE on the first treatment, and the remainingsubjects on the second treatment.
7 (c) We have obtained the sampling distribu-tion of the test statistic on the assumptionthat the Skeptic is correct. It also is possi-ble to obtain a sampling distribution of thetest statistic if the Skeptic is wrongpro-videdwe specifyexactlyhow the Skepticis in error. These new sampling distribu-tions are used in the study ofstatisticalpowerwhich is briefly described in Chap-ter 7 of the text. Assume that the Skepticis correct about subjects C, D and E, butincorrect about subjects A, B and the assignment that puts D, E and Gon the first treatment, and the other sub-jects on the second treatment, determinethe response for each of the six Consider an unbalanced study with six subjects,identified as A, B, C, D, E and G.
8 In the actualstudy, Subjects A and B are assigned to the firsttreatment, and the other subjects are as-signed to the second treatment. There are exactly two successes, obtainedby A and information is needed for parts (a) (c) be-low.(a) Compute the observed value of the teststatistic.(b) Assume that the Skeptic is correct. Deter-mine the observed value of the test statis-tic for the assignment that places D and Eon the first treatment, and the remainingsubjects on the second treatment.(c) We have obtained the sampling distribu-tion of the test statistic on the assumptionthat the Skeptic is correct.
9 It also is possi-ble to obtain a sampling distribution of thetest statistic if the Skeptic is wrongpro-videdwe specifyexactlyhow the Skepticis in error. These new sampling distribu-tions are used in the study ofstatisticalpowerwhich is briefly described in Chap-ter 7 of the text. Assume that the Skepticis correct about subjects A and G, but in-correct about subjects B, C, D and the assignment that puts D and G onthe first treatment, and the other subjectson the second treatment, determine the re-sponse for each of the six A comparative study is performed; you aregiven the following information.
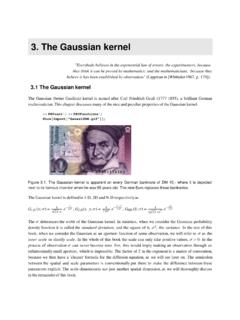
10 The total number of subjects equals 33. The observed value of the test statistic isgreater than used the website to obtain the exact P-value forFisher s test for each of the three possible alter-natives. These three P-values are below alongwith three bogus 1 2 (a) Which set contains the correct P-values: 1or 2? (No explanation is needed.)(b) For the set you selected in part (a), matcheach P-value to its alternative. (No expla-nation is needed.) Note: Even if you pickthe wrong set in part (a), you can still getfull credit for part (b).9. A comparative study is performed; you aregiven the following information.