Transcription of Presentazione standard di PowerPoint
1 Principal messages 1. Uncertainty and profound asymmetries between developed and developing countries in: Policy response capacity (macroeconomic, productive, social and health) with divergences in the velocity and recovery of growth and investment. Advanced economies alone are projected to return to their forecasted pre-pandemic growth trajectory in 2022. Emerging economies would only return to it in 2025. 2. Less global growth and trade, slowdown in the United States and China a financial context with greater uncertainties and more restrictive. 3. The region faces a less favourable external context and a strong deceleration of growth, less fiscal space, inflationary pressures and exchange rate volatility. 4. Low investment and productivity, slow recovery in employment and persistence of the social effects caused by the crisis.
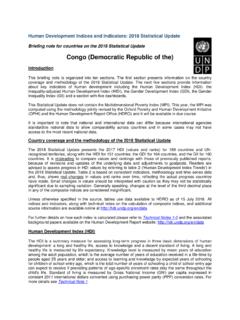
2 5. It is essential to maintain growth through coordinated fiscal and monetary policies to prioritize the challenges of growth and monetary-financial stability. 2. Asymmetries in the spaces to undertake active fiscal policies SELECTED ADVANCED ECONOMIES (20 COUNTRIES): DISCRETIONAL EXPENDITURE AND REVENUE. Advanced economies have MEASURES ANNOUNCED OR IMPLEMENTED TO FACE THE CRISIS DERIVED FROM COVID-19, JANUARY. maintained fiscal stimulus, TO SEPTEMBER 2021a (In percentages of 2020 GDP). taking advantage of favourable financing 10. conditions - low interest rates (negative in some 8. cases). 6 Between January and September of 2021, 4. advanced economies announced new fiscal 2. measures in the order of trillion dollars vs 330 0. billion in emerging Italy Norway Denmark Singapore France United States Rep.
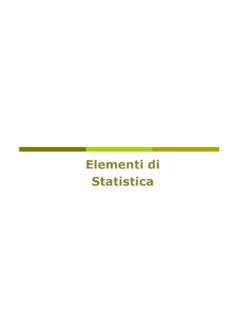
3 Of Korea Belgium Australia Netherlands Germany Finland Canada Japan Spain Great Britain Portugal New Zealand Switzerland Czechia markets. Source: Economic Commission for Latin America and the Caribbean (ECLAC), on the basis of IMF (2021c) and IMF (2021a). a Includes measures announced or in the process of implementation between January and September 2021. 3. Asymmetries in the response of monetary policy interest rates: up to now the largest rate increases have been made by emerging economies Interest rates in the main advanced economies remain at historic lows Change in policy Change in policy Country / Interannual Interannual Change in policy Policy rate rate (last year, in Country / Region Policy rate rate (last year, in Interannual Region inflation inflation Country / Region Policy rate rate (last year, in basis points) basis points) inflation basis points).
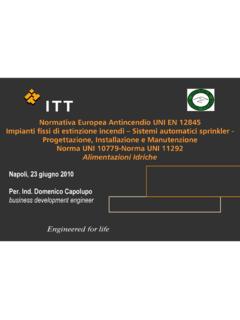
4 Australia 0 Bahrain 0 Canada 0 Bulgaria 0 Brazil 725 Czech Rep. 250 China 0 Denmark -50 Croatia 0 Chile 350 Egypt 0 Euro zone 0. Hungary 180 Colombia 125 Hong Kong 0 India 0 Iceland 100 Indonesia -25 Mexico 125 Israel 0 Lebanon 0 Japan 0 Peru 225 Malaysia 0 New Zealand 50 Morocco 0 Norway 50 Oman 0 +. Singapore 5 Pakistan 275 South Korea 50 Philippines 0 Level of the policy rate Sweden 0 Poland 165 - Switzerland 0 Qatar 0 +. Romania 25 15 0 Russia 325 Change in the policy rate Saudi Arabia 0 - South Africa 25 Thailand 0 +. Turkey -100 Variation in prices Source: Economic Commission for Latin America and the Caribbean (ECLAC), Ukraine 300 - on the basis of Bloomberg as of December 16 2021. 4. The motivation for the plan: unequal access to vaccination LATIN AMERICA AND THE CARIBBEAN (33 COUNTRIES): PERCENTAGE OF TOTAL POPULATION WITH.
5 COMPLETE VACCINATION SCHEME The region has vaccinated almost 60% of its (In percentages) population, with important advances but also great Chile Cuba differences between countries Uruguay Argentina Ecuador PERCENTAGE OF TOTAL POPULATION. Costa Rica Brazil WITH COMPLETE VACCINATION SCHEME. Peru El Salvador Latin America and the Carubbean (33 countries) Antigua and Barbuda Colombia Panama Mexico Dominican Rep. Barbados Belize Trinidad and Tabago Saint Kitts and Nevis Nicaragua Honduras European Union North America Latin America The Caribbean Paraguay (United States and (19 countries) excluding Cuba and Bolivia (Plur. State of) Canada) the Dominican Venezuela (Bol. Rep. of) Republic Suriname (14 countries). Dominica The Bahamas Guyana Purchases of some countries surpass their vaccination needs.
6 Grenada Saint Lucia European Union, United States, United Kingdom, Canada and Guatemala Saint Vincent and the Grenadines Japan represent 39% of purchase commitments, while making up Jamaica Haiti only of the world's populationa. Source: Economic Commission for Latin America and the Caribbean (ECLAC), ECLAC's COVID-19 Observatory, Source: Economic Commission for Latin America and the Caribbean (ECLAC), on the basis of Our World in Data [online] on the basis of Duke Global Health Innovation Center. (2021). Launch and Scale Speedometer. Duke University. Note: Registry for countries that report the breakdown of administered doses (first and second) as of January 10, 2022 or latest available date. Retrieved from: for November 19th 2021 or latest available date. Global GDP growth projections are lower for 2022 than for 2021, in particular for the region's main commercial partners, the United States and China SELECTED REGIONS AND COUNTRIES: GDP GROWTH RATES, 2020 AND PROJECTIONS.
7 FOR 2021 AND 2022 . (in percent). 2020 2021 2022. World Developed United States Japan United Eurozone Emerging Emerging Asia China India Emerging Middle East Sub-Saharan economies Kingdom markets and Europe and Central Africa developing Asia economies Source: Economic Commission for Latin America and the Caribbean (ECLAC), on the basis of Organization for Economic Cooperation and Development (OECD), OECD Economic Outlook, Interim Report September 2021, September 2021;. International Monetary Fund (IMF), World Economic Outlook (WEO), October 2021; European Central Bank (ECB), Eurosystem staff macroeconomic projections , September 2021 and Capital Economics accessed 18 October 2021. a In India, the fiscal year begins in April and ends in March the following year. 6. Trade volumes are also expected to register slower growth in 2022, vs in 2021.
8 WORLD TRADE VOLUME: YEAR-ON-YEAR RATE OF CHANGE, JANUARY 2003 SEPTEMBER 2021. (Percentages, on the basis of a seasonally adjusted index). 30% (En porcentajes, sobre la base de un ndice desestacionalizado, promedios de tres meses m viles). 25%. 20%. Forecast 2021. 15% Jan 2003 - June 2007 8%. 10% 2017 2018 Forecast 2022. Jul 2011 - Dec 2015 5% 2%. 0%. 2016 2019 2020. -5% -10%. -15%. -20%. -25%. Jan-03. Mar-04. Feb-07. Sep-07. Mar-11. Feb-14. Sep-14. Feb-21. Sep-21. Jul-06. Apr-08. Jan-10. Jul-13. Apr-15. Jan-17. Mar-18. Apr-22. Aug-03. Nov-08. Aug-10. Nov-15. Jul-20. Aug-17. Nov-22. May-05. Dec-05. May-12. Dec-12. May-19. Dec-19. Oct-04. Jun-09. Oct-11. Jun-16. Oct-18. Source: Economic Commission for Latin America and the Caribbean (ECLAC), on the basis of Netherlands Bureau for Economic Policy Analysis (CPB), World Trade Monitor, World Trade Monitor [online database].
9 And World Trade Organization (WTO), La recuperaci n del comercio mundial supera las expectativas, aunque con divergencias regionales , Press Release, 4th October 2021. [online], 7. Commodity prices are expected to stabilize in 2022 after rising strongly in 2021. ANNUAL VARIATION IN MEAN INTERNATIONAL COMMODITY PRICES, 2020 AND PROJECTIONS FOR 2021 AND 2022. Projected price changes Projected price changes Price changes 2020 (%). 2021 (%) 2022 (%). Agricultural products Food, tropical beverages and oilseed Food Tropical beverages Vegetable oilseeds and oils Agricultural raw products Minerals and metals Energy Crude oil Total primary products Total primary products (excluding energy) Source: Economic Commission for Latin America and the Caribbean (ECLAC), on the basis of World Bank (The Pink Sheet) Data [Online] and for the projections 2021 source: International Monetary Fund (IMF); Economist Intelligence Unit, Bloomberg; Energy Information Administration (EIA), "Short-Term Energy Outlook", Capital Economics and Banco Central de Chile, Informe de pol tica monetaria, septiembre 2021 Santiago de Chile, for the copper price.
10 8. After a strong recovery of exports and imports in 2021, growth is expected to continue in 2022, but at a more moderate rate LATIN AMERICA AND THE CARIBBEAN: RATE OF CHANGE IN THE TRADE OF GODOS, BY VALUE, VOLUMEN AND PRICE, 2000 TO 2022. (In percentages). EXPORTS IMPORTS. 40. 30. 25 32. 20 8 30. 10 20 20. 10. 17 4 9. 6 10. 0 12 5. 4. 0. -10. -10. -20 -20 -16. -30 -30. 2000. 2001. 2002. 2003. 2004. 2005. 2006. 2007. 2008. 2009. 2010. 2011. 2012. 2013. 2014. 2015. 2016. 2017. 2018. 2019. 2020. 2021. 2022. 2000. 2001. 2002. 2003. 2004. 2005. 2006. 2007. 2008. 2009. 2010. 2011. 2012. 2013. 2014. 2015. 2016. 2017. 2018. 2019. 2020. 2021. 2022. precio volumen valor Price Volume Value Source: Economic Commission for Latin America and the Caribbean (ECLAC), on the basis of figures of the International Trade and Integration Division of ECLAC.