Transcription of Product Bulletin ValveLink Software September …
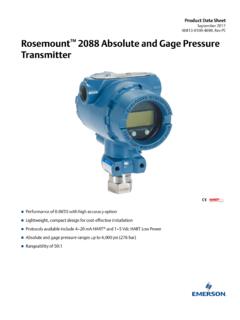
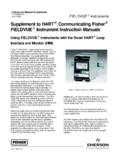
1 Band Plus Hysteresis Estimation withValveLink DiagnosticsBackgroundDead band and hysteresis are important nonlinearities that can adversely affect process control. Figure 1 shows inputand output graphs for hysteresis, dead band, and dead band plus hysteresis. Hysteresis is a path dependentcharacteristic that can be attributed to materials not being able to return to their original shape and size after beingstretched or deformed. Dead band represents the amount of signal change required to reverse direction and ischaracterized by a zero slope region where the input signal reverses. Dead band can usually be attributed to valvefriction (packing, actuator seal rings, and valve seal rings) and pneumatic dead zones in the 1.
2 Hysteresis, Dead Band, and Dead Band plus Hysteresis CurvesYBHYSTERESISERROR100%OUTPUT100% INPUTA"INPUTOUTPUTDEAD BANDy2y1yxx1x2"A"AHYSTERESISERROR WITHDEAD BANDDEAD BANDERRORERROR100%INPUT100%y2y1 OUTPUTDEAD BANDxBYFor control valves, dead band is the dominant nonlinearity whereas hysteresis is a secondary effect. Hysteresis can beestimated by subtracting dead band from the dead band plus hysteresis data. However, since hysteresis is generallynegligable and difficult to discern from experimental error, dead band and hysteresis are not separated and test resultsare reported as the sum of these dead band plus hysteresis is process dependent but is typically specified to be 1% for the entire valveassembly, which comprises the valve, actuator, and Band plus Hysteresis Test DefinitionDead band plus hysteresis can be estimated at the factory using a Series 3 Factory ValveLink test.
3 Although dead bandplus hysteresis is a factory test, results can be imported and viewed in all versions of ValveLink Software . Dead bandplus hysteresis tests can be run at nominal travels of 5%, 25%, 50%, 75%, and 95%. If a test point is not specified, deadband plus hysteresis will be evaluated at a nominal travel of 50%. ValveLink SoftwareD103549X012 Product : ValveLink Software (S3) September 2017 ValveLink SoftwareD103549X012 Product : ValveLink Software (S3) September 2017 2 Test ProceduresDead band plus hysteresis is a static measurement that can be estimated using a quasi steady state test signal. Alltests are performed using standard digital valve controller diagnostic procedures with the cutoffs and characterizationdisabled and with the travel integrator disabled.
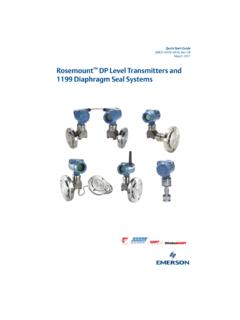
4 This is done to prevent limit cycles, overshoots, or other transientsthat would invalidate the dead band plus hysteresis dead band plus hysteresis test is a 29 point step test that consists of series of steps that slowly move thevalve in the opening and closing directions. Figure 2 shows a test signal centered around 50%. Test signal span is each step is held for 45 seconds, although this can be set to 60 or 90 seconds in the factory to ensure that quasisteady state conditions are dead band plus hysteresis test consists of two sequences. The first sequence is a break in cycle that moves thevalve through its dead band and establishes a valid starting point for the second sequence.
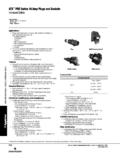
5 Data from the break incycle are not analyzed. The second sequence is the test cycle and data from this sequence are used to estimate deadband plus 2. Dead Band plus Hysteresis Test about a Nominal Set Point of 50%Time (sec)0200400600800100012001400 Travel Set Point (%) ResultsFour graphs are used to display test results: step response time series, step response with supply pressure, stepresponse with drive, and dead band plus hysteresis X-Y step response graph displays travel set point and travel time series data. A typical time series plot of travel setpoint and travel is presented in figure 3. This graph is used to make sure that steady state conditions have beenreached before the next step is implemented.
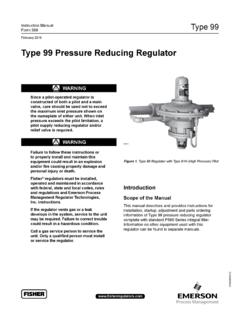
6 If this is not the case, the dead band plus hysteresis test can be rerunwith a longer step hold time. This graph can also be used to roughly estimate dead band by counting the number steps required to reverse response time series data with supply pressure and drive signal are also available and are recorded , steady state data can be displayed on an X-Y plot where set point is plotted on the x axis (input signal) andtravel is plotted on the y axis (output signal). A sample X-Y dead band plus hysteresis is shown in figure SoftwareD103549X012 Product : ValveLink Software (S3) September 2017 3 The ideal response of a control valve is a straight line with unity slope.
7 Dead band plus hysteresis can be estimated bydrawing lines parallel to the ideal response that band the data. The width between the bands provides the bestestimate of dead band plus 3. Typical Travel Set Point and Travel Time Series PlotsTARGETDATANote: The first cycle is a break-in cycle. The second is a test 4. Dead Band plus Hysteresis X Y Plot with Unity Slope BandsOPENING DIRECTIONUPPER DEADBAND LIMITLOWER DEAD BAND LIMITCLOSING DIRECTIONV alveLink SoftwareD103549X012 Product : ValveLink Software (S3) September 2017 4 Data ExportDead band plus hysteresis data from factory ValveLink can be exported as a standard step study test. When importedinto ValveLink or higher, time series and dead band plus hysteresis X-Y plots can be displayed.
8 For earlier versionsof ValveLink , only time series data will be [1] ANSI/ISA 2000 (R2005), Control Valve Terminology. [2] ANSI/ISA 1996 (2007), Method of Evaluating the Performance of Positioners with Analog Input Signalsand Pneumatic Output. [3] ANSI/ISA 2000, Test Procedures for Control Valve Response Measurement from Step Inputs. [4] ANSI/ISA 2002, Control Valve Response Measurements from Step Inputs. [5] IEC 60534 1, Industrial process control valves Part 1: Control valve terminology and general considerations. [6] IEC 60534 4, Industrial process control valves Part 4: Inspection and routine testing. [7] Control Valve Dynamic Specification, Version , EnTech, 1998.
9 [8] (R1993), Process Instrumentation Terminology. Emerson Automation Solutions Marshalltown, Iowa 50158 USAS orocaba, 18087 BrazilCernay 68700 FranceDubai, United Arab EmiratesSingapore 128461 contents of this publication are presented for informational purposes only, and while every effort has been made to ensure their accuracy, they are notto be construed as warranties or guarantees, express or implied, regarding the products or services described herein or their use or applicability. All sales aregoverned by our terms and conditions, which are available upon request. We reserve the right to modify or improve the designs or specifications of suchproducts at any time without 2011, 2017 Fisher Controls International LLC.
10 All rights and ValveLink are marks owned by one of the companies in the Emerson Automation Solutions business unit of Emerson Electric Co. EmersonAutomation Solutions, Emerson, and the Emerson logo are trademarks and service marks of Emerson Electric Co. All other marks are the property of theirrespective Emerson, Emerson Automation Solutions, nor any of their affiliated entities assumes responsibility for the selection, use or maintenanceof any Product . Responsibility for proper selection, use, and maintenance of any Product remains solely with the purchaser and end user.