Transcription of Project Risk Analysis Model - Washington State Department ...
1 Project Risk Analysis Model User's Guide PRAM. Strategic Analysis and Estimating Office March 2018. Terms Base Cost Estimate The reviewed or validated Project cost estimate used in quantitative risk Analysis . It represents the expected cost if the Project materializes as planned, including PE, RW, and CN costs. It is unbiased and neutral (neither optimistic nor conservative). Base Variability The ordinary quantity and price variations about the estimated base. It is captured as a modest symmetric range about the estimated value, of the form: base value x% . typically from 5% to 15% depending on level of Project development and complexity of the Project . Estimate A quantitative assessment of the likely amount or outcome. Refers to Project costs, and durations typically preceded by a modifier ( preliminary, conceptual, order-of- magnitude, etc.). An indication of accuracy ( x percent). An estimate has two components: the base cost estimate component and the risk/uncertainty component.
2 An estimate is best expressed as a range, not a single number. Impact A consequence of a risk occurring in terms of cost ($) or months (mo); expressed as a range defined by three values: minimum, maximum, and most-likely . A threat impact adds cost or delay; an opportunity impact adds value or reduces cost. Mitigation Action taken to reduce the impact or likelihood of an undesirable risk event or events. Opportunity An event risk that has the potential to positively impact Project objectives. Probability An estimated likelihood that a particular risk event will occur. Often expressed on a scale of 0 to 10 or 0 to 100 percent. Estimates of probability are often subjective, as the combination of tasks, people and circumstance varies among projects. Qualitative An assessment of risk relating to the qualities and subjective elements of the risk . assessment those that cannot be quantified accurately. Qualitative techniques include the identification of risk, recording risk details and relationships, categorization and prioritization of risk relative to each other.
3 Quantitative Analysis Modeling of numerical outcomes by combining actual or estimated values with an assumed or known relationship between values, using arithmetic or statistical techniques, to determine a range of likely outcomes of a variable or to understand how variance in one or more values is likely to affect others. Risk Effect of uncertainty on objectives. Risk Events Uncertain events that affect the Project resulting in impacts to cost, schedule, safety, performance or other characteristic but do not include the minor variance inherent in Base Costs. Risk Register The risk register serves as a repository for identified Project risks . The risk register includes detailed information about the risk and is a living document that evolves as the Project evolves. Risk Response The process of developing response actions to identified risk events that enhance opportunities and reduce threats to Project objectives. Threat An event risk that has the potential to negatively impact Project objectives.
4 Uncertainty The lack of knowledge of the outcome for a particular element or value. YOE Year Of Expenditure. The estimated year that money will be spent to complete Project work elements. Base costs reported to program management shall be in current-year dollars (the un- inflated estimate). Additional terms for Risk Management may be found in the WSDOT Glossary for Cost Risk Estimating Management Contents Project Risk Analysis Model (PRAM). Overview .. 1. Two-in-One .. 2. Basic Parts .. 3. Workbook Sheets: Inputs .. 4. Workbook Sheets: Outputs .. 5. Using the PRAM. Basic Steps .. 7. Before Using .. 8. Get the Workbook .. 8. Open the Workbook / Table of Contents / Navigation .. 8. Reordering Risk Sheets .. 10. Entering Data .. 10. Base Estimate .. 11. Risk Sheets . 15. Model Input Tables . 20. Run the Project Risk Analysis Model .. 21. Viewing the Results . 22. Risk Response .. 24. Risk Response Analysis Inputs .. 26. Running the Risk Response Model . 29.
5 Appendix Risk Breakdown Structure .. 31. Conditionality .. 33. Project Risk Analysis Model : Overview A Risk Model simulates events that may occur in the real world. For Project risk Analysis , attention is focused on events that can affect Project objectives such as cost and schedule. The Project Risk Analysis Model (PRAM) uses Monte Carlo simulation to generate cost and schedule probability distributions from user input cost, schedule, risk and uncertainty information. It produces quantitative risk Analysis outputs that provide actionable information to Project managers and teams. The Model runs thousands of simulations or Project realizations that virtually execute the Project under the influence of all input uncertainties and risks . For each realization some risks occur, some do not; some impacts are high and others are low. The output provides an estimated range of Project cost and schedule outcomes. Few realizations reach the extreme limits of the distribution, most aggregate toward the middle.
6 Up to 24 individual risks may be entered into the Model . The outputs present statistical summaries, graphically as a distribution histogram, a cumulative distribution function S-curve, and as a percentile table. The Model reports cost distribution forecasts for Preliminary Engineering (PE), Right of Way (RW), and Construction (CN) as well as total Project cost. Results are provided in Current Year (CY) dollars and as inflated to Year of Expenditure (YOE) dollars. There are two schedule distribution forecasts, contract advertisement date and end of construction date. There are also tornado diagrams, sorting risks by expected value (EV), by cost and schedule impact. The Model accommodates two analyses. The first is for analyzing Project estimate exposure to risks as initially identified and assessed, and the second is for analyzing the response to those risks . Comparing the pre-mitigated and post mitigated results offers users a quantified measure of the value added by proactive Project risk management.
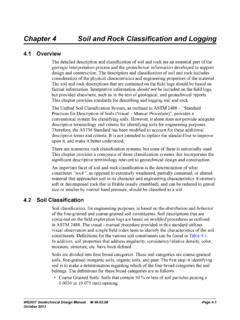
7 The Base Estimate and Risk input forms serve both analyses. Color-coding is used throughout the Model to promote instant recognition of which Analysis inputs or results are which: ORANGE = Risk Analysis (pre risk-response: pre-mitigated risk Analysis ). BLUE = Risk-Response Analysis (post risk-response: post mitigated risk Analysis ). Two-in-One The following illustration shows the two analyses available in the Model , how they are color- coded, and how single input sheets are used for each: 2|P A G E. Basic Parts 3|P A G E. Workbook Sheets The PRAM workbook contains sheets for data input and for output reports of simulation results. These sheets serve to record the Risk Analysis pre risk-response and the Risk-Response Analysis entries and results. The respective zones are clearly labeled and color-coded. Inputs BASE Estimate (Sheet: Base). Base Estimate Users enter the expected cost as if the Project goes as planned. The BASE Cost Pre Risk- is an unbiased neutral estimate of cost and schedule; care should be taken Response that information entered is neither conservative nor optimistic.
8 The BASE. estimate captures the total estimated Project costs including, preliminary engineering, right-of-way, construction, Mobilization, Construction Engineering, Post Risk- Response Tax, Change Order Contingency, and below the line items (700/800 items). (WSDOT standard construction contingency amount is based upon historical usage). The upper portion is for the initial Project Risk Analysis . The lower portion Base accounts for any base estimate adjustments due to risk response strategies the Risk Response Analysis . Values are entered in Current Year (CY) dollars. Risk Form Pre RISK (Sheets: identifications vary) Response The simulation handles up to 24 discrete risks . Each Risk sheet records an identified risk associated with the Project under study: the phase it affects, Post its details, probability and quantified consequences. The upper portion of Response the form is about the risk as it is first identified, with no regard to doing anything about it, , before any response strategy pre risk-response Risk AB.
9 Risk values, or pre-mitigated risk. The lower portion details the proposed Risk C. response strategy with any expected change to likelihood or impact due to implementing the strategy the post risk-response values, or Post-mitigated Risk. Project risks can pose a Threat of negative impacts to Project objectives, or present an Opportunity that has a positive impact. Model Input Tables: Inter-Risk Conditionality / Model Input Synopsis RMP ( risks ordered 1 12) & RMPS uppl ( risks ordered 13 24) Model Input Tables Data entered in the individual forms for Risk Analysis (pre risk- RUN. response) appear in these tables. The first twelve risks (1 12), in the same order as workbook sheet tabs, are in one, the second 1 $ . twelve (13 24), are in the other. At the top of each table is a 2 $ . summary of (pre risk-response) Base Estimate inputs. 3. This is where to Indicate conditionality between risks , to Model 4. basic correlations, dependencies, and duration links.
10 See later RMP RMPS uppl section for more details. The Model -engine uses the inputs from these sheets. Review the inputs before running. 4|P A G E. RMPM ( risks ordered 1 12) & RMPS upplM ( risks ordered 12 24) Model Input Tables Data entered in the individual forms for Risk-Response Analysis RUN. appear in these tables. The first twelve risks (1 12), in the same order as workbook sheet tabs, are in one, and the second 1 $ . twelve (13 24), are in the other. At the top of each table is a 2 $ . summary of (post risk-response) Base Estimate inputs. 3. Revise or indicate conditionality between risks accordingly, to 4. reflect the effects of response strategies (more detail provided RMPM RMPS upplM. later in this guide). Review the Model inputs here before running. Outputs Expected Value (sheet: EV). Graphs on this sheet sort entered risks by Expected Value (EV) as an Expected aid for optimizing the risk-response effort. Typically, risks at the top warrant the most attention, with a diminishing rate of return on Value effort as we descend on the diagram.