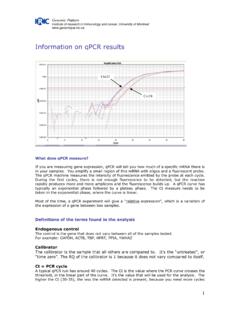
Transcription of Protein Thermal Shift Assay Using Applied Biosystems Real ...
1 2009 Life Technologies CorporationProtein Thermal Shift Assay Using Applied Biosystems real Time PCR SystemsMadeline O Donoghue1, Patrice Allard1, Astrid Ferlinz1, Joris Verheyde1, Kelly Warrington1 Naima Nhiri2, Eric Jacquet21 Applied Biosystems , part of Life Technologies, Foster City, CA. 2 IMAGIF, B t 23B, ICSN-CNRS, Gif-sur-Yvette, France, 6. Normalized Melt Curve data generated on a 7900 HT real Time PCR System showing the effect of a specific ligand on Protein stability. The Tm of the curve increases over 10oC in the presence of the 5. Derivative Melt Curve data from a 7900 HT real Time PCR System depicting a TSA Assay measuring the effect of salt concentrations on Protein thermostability.
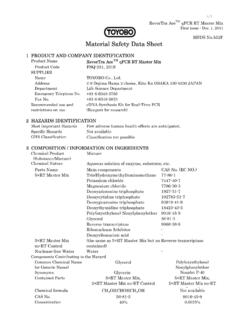
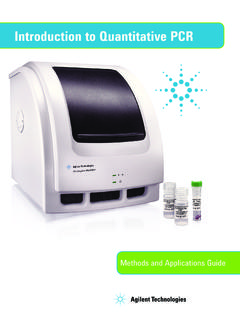
2 The Tm of the Protein of interest increases with different concentrations of salt in the 4a. & 4b. Variation in Tm as a function of pH. TSA Normalized Melt Curves and associated graph, demonstrating optimal Protein stability (highest Tm ) in a solution at pH 2. Example TSA data from a StepOnePlusTM showing the Normalized Reporter and Derivative Melt profiles from experimental Lysozyme samples. Data was collected at 1oC intervals from 25oC through to 98oC. ABSTRACTThe Protein Thermal Shift Assay (TSA) is a rapid and sensitive tool for monitoring Protein thermostability, aiding in the identification of optimal conditions or conformations/sequences that favour Protein stability, including the investigation of Protein -ligand interactions.
3 TSA is based on temperature-induced Protein denaturation, monitored Using an environmentally sensitive dye, such as SYPRO Orange3. The fluorescence data is plotted and the midpoint or Tm of the resulting curve is taken as a reference of the Thermal stability of a Protein of interest4. Comparisons can then be made between Tm values obtained Using a range of buffer conditions or addition of different ligands. TSA data have been obtained from the whole range of Applied Biosystems real Time PCR Systems, including the 7900 HT, 7500 Fast5 and StepOnePlusTM real Time PCR Instruments, demonstrating the versatility of these systems. The benefits of performing a TSA with an AB real Time PCR System include the flexibility of run- method programs, catering for a range of data resolution requirements, and in the use of small reaction volumes, providing fast and accurate results with only a few g of difficulty and expense often involved in isolating or obtaining a Protein of interest, demands that care be taken with subsequent handling or storage in order to maximise the utility and longevity of the Protein and to ensure data quality is not effected by degradation or aggregation events.
4 Conditions that favour long- term stability are a common requirement for almost all research or Applied techniques involving proteins. There are many factors that may affect Protein stability, including salt concentrations, pH or the use of specific ligands that can interact with proteins in different ways. Given the large number of possible combinations one could test in order to determine the environmental conditions that would favour maximum stability, it is highly desirable to adopt a technique that can simplify and streamline the investigation Thermal Stability Assay (TSA) on AB real Time PCR Systems is a fast and convenient screening method, and the use of a non-specific dye such as SYPRO Orange alleviates any requirement for prior knowledge of Protein function or ligand activity.
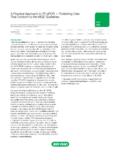
5 In the presence of a native Protein , the dye is naturally quenched, when the Protein of interest starts to denature in response to an increase in temperature, exposing the hydrophobic core of the Protein , the dye will react to this change in environment and will start to fluoresce (see Figure 1). Figure 3. Replicate TSA data from 96-well plate Using the 7900 HT real Time PCR System, demonstrating high level of is not necessary to calibrate an AB real Time PCR System for the SYPRO Orange Dye, however calibration may improve results in some instances. Recommendations for calibration involve the use of a full plate of replicate conditions with a high enough concentration of Protein to achieve maximum fluorescence (as described in the Maintenance Guides for each specific system), for example, with the 7900 HT real Time PCR System, an rfu value of 30,000 would be sufficient.
6 Applied Biosystems , and AB (Design) are registered trademarks and StepOnePlus is a trademark of Applied Biosystems or its affiliates in the US and/or certain other countries. 2009 Applied Biosystems . All Rights is registered with the US Patent and Trademark Office by Molecular Probes References3 SYPRO Orange Protein Gel Stain SKU#-S66504 Neisen - Published online 13 September 2007; Malawski Protein Sci. 2006 15: 2712-2718 Figure 1. Schematic of the predicted action of SYPRO Orange Dye. The naturally quenched dye will only fluoresce when exposed to the hydrophobic regions of a denaturing is a rapid, inexpensive and straight forward tool for screening of suitable conditions that maximise Protein stability.
7 The use of AB real Time PCR Instruments offers a range of benefits to assist the TSA testing workflow, combining the ease of handling and throughput capacity of a plate-based system with the ability to hold samples at sub-ambient temperatures. In addition, the flexibility of the operational software allows for the collection of fluorescent data across a wide temperature range at any desired ramp speed, with data easily viewed within the system software, or exported for further analysis RequirementsAll AB real Time PCR Systems are capable of performing TSA Using SYPRO Orange Dye. Following is an outline of instrument features that are beneficial when performing a TSA: Ability to hold samples at sub-ambient temperatures and collect data across a full temperature range (4oC 99oC) Ability to control melting ramp rates for higher or lower resolution, as required Ability to excite at 480nm and read fluorescence around 568nm Flexibility in reaction volumes (5-50 l) to enable all possible test environments Reproducibility across replicate samples to ensure accuracy in delta measurements between test samples (Figure 3).
8 Fluorescence data is collected by the real Time PCR instrument throughout the temperature ramp, a melt curve is generated, and the midpoint or melt peak can be determined for each well across a 96 or 384 well plate (Figure 2). Comparisons of the resulting Tm values can be used to determine the relative stabilizing properties of the test EXAMPLE EXPERIMENTSThe following examples were generated Using an AB 7900 HT real Time PCR instrument, Using the Dissociation Curve run method and modifying the ramp rate as of pH on Protein StabilityThe delicate tertiary structure of many proteins can be difficult to maintain during handling and storage. The pH of a chosen buffer will certainly affect Protein stability as changes in pH alter the electrostatic interactions between charged amino acids.
9 Using the screening approach of the TSA it is possible to test a range of pH conditions in a single Assay . The changes in the resulting Tm of the Protein in solution can be used as a measure of the relative stability across the tested pH 4a shows the normalized melt curve data generated from a single 96-well plate on the AB 7900 real Time PCR System, containing duplicate reactions of a Protein in solution across a pH range of The Tm values of the TSA melt curves (omitting the two obvious outlier groups) span across a ten degree window, clearly demonstrating the effect of pH on the resulting Thermal stability of the Protein being tested.
10 Figure 4b plots the Tm values obtained against the solution pH, where it can be determined that a buffer solution at pH leads to the most stable conditions. Effect of Salt Concentration on Protein StabilityThe salts within a storage or handling buffer also interact with the charged amino acids of a Protein ultimately affecting the stability of the resulting Protein tertiary structure. Figure 5 depicts the derivative melt curves of a representation of wells from a TSA experiment investigating the effect of a range of salt concentrations on the stability of a Protein of interest. There are clear differences in Tm across the plot, ranging over a ten degree span, demonstrating the effect of salt concentrations on Protein Thermal of Ligand Interaction on Protein StabilityLigands are small molecules or substances that may exhibit specific affinities for some proteins, and through the formation of the Protein -ligand complex, can affect the stability of a Protein of interest, for example by changing the Protein structure or conformational stability.