Transcription of Psychometric Properties of the Student Version
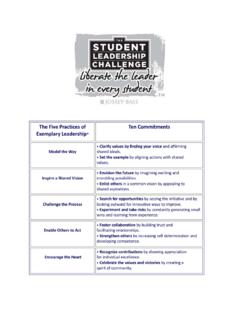
1 1 Psychometric Properties of The Student leadership practices inventory Barry Z. Posner February 2010 There continues to be considerable interest in youth and college Student leadership development among secondary and tertiary institutions as well as among scholars. This is evident in the ever increasing number of courses being taught on leadership and programs incorporating a focus on leadership with students and the expanding number of studies being conducted by leadership educators and scholars. One of the most prominent and well regarded leadership frameworks for youth leadership is The Five practices of Extraordinary Leaders (Kouzes & Posner, 2008). This approach looks at the actual behaviors of people when they are at their personal best as leaders, and postulates five key behaviors: Modeling the Way, Inspiring a Shared Vision, Challenging the Process, Enabling Others to Act, and Encouraging the Heart.
2 Kouzes and Posner (2007, 2011) have argued that leadership is a set of skills that can be learned, and that these skills can be acquired and engaged in by anyone. The leadership practices inventory (Kouzes & Posner, 1988) was created in order to enhance the development of leaders through feedback on their current behaviors and actions, as evidenced by themselves as well as others. The effectiveness of feedback -- especially 360-degree feedback in an organizational context from superiors, subordinates, peers, and even customers -- has been well documented. The leadership practices inventory (LPI) is one of the most widely used and well-regarded leadership development instruments. In its current electronic online format it has been completed by over million respondents around the world in just the past three-four years alone. A Student Version of the LPI was created in the mid-1990s and its development, reliability and validity have been well documented (Posner & Brodsky, 1992, 1993, 1994; Posner & Rosenberger, 1997; Posner, 2004, 2009).
3 An electronic online Version of the Student leadership practices inventory ( Student LPI) was launched in 2007 which substantially enhanced the accessibility of the instrument to youth leaders and Student leadership educators. 2 This manuscript updates the Psychometric Properties of the Student LPI (Posner, 2004). In addition, it examines the Student LPI in relationship to a set of demographic variables; ands explores the impact of leadership experience and formal leadership development opportunities on leadership practices . Finally, the relationship between engagement in the five leadership practices and leadership effectiveness is investigated. This document is primarily a descriptive report about the Student LPI. Other than verifying the reliability and validity of the Student LPI it does not test a specific set of hypotheses or provide general information on the use of the Student LPI by Student leaders and Student leadership development educators.
4 Sample Characteristics This sample consists of respondents to the online Version of the Student LPI from a two year period beginning August 2007 through August 2009. This total sample involves 38,944 respondents, with about 21 percent being leaders (Self respondents; N = 8,208) and 79 percent being observers (generally peers; N = 30,736). After completing the Student LPI, all respondents are given the option of providing demographic information about themselves, and answering a few evaluative questions. Approximately 25 percent of the total sample availed themselves of this option. There is no reason to expect a systematic difference between the characteristics of this sample and that of the total population who completes the Student LPI. Tables 1 through 5 provide descriptive information about the sample. Table 1 shows the age distribution from respondents in both the Self and Observer category.
5 Over one-third of the Self respondents are between the ages of 18-20 years, with just about 20 percent being 15 years of age or younger. Among Observers, the most frequent age category is 31 years or older, followed closely by 18-20 year olds and 21-23 year olds. Chi-square analysis reveals that the distributions of these two groups in terms of ages is not equivalent (chi-square = , p < .001). 3 Table 1: Age Distribution of Self and Observers Age Self Observer N % N % 15 years and under 380 1194 16-17 years old 208 718 18-20 years old 748 1465 21-23 years old 344 1457 24-27 years old 117 577 27-30 years old 42 384 31 years and older 100 2094 Chi-square = , p < .001 Table 2 shows the distribution of respondents by year in school. Just over one-half of the Self respondents are in college, approximately 30 percent are in high school, percent are college graduates and about 8 percent are graduate students .
6 Similarly, among the Observers just over one-half are college students , about 25 percent are in high school, nearly 7 percent are college graduates and over 15 percent are in graduate school. Chi-square analysis reveals that the distributions of these two groups for year in school is not equivalent (chi-square = , p < .001). Table 2: School Year Distribution of Self and Observers School Year Self Observer N % N % High School Frosh 95 284 HS Sophomore 190 568 HS Junior 200 671 High School Senior 75 228 College Frosh 297 426 College Sophomore 58 1472 College Junior 301 880 College Senior 327 1038 College Graduate 177 483 Grad School Student 148 1090 Chi-square = , p < .001 4 Table 3 shows the distribution of respondents by gender.
7 Females dominant both samples, with over 62 percent among the Self respondents and almost 59 per cent among the Observer respondents. Chi-square analysis reveals that the distribution of genders for these two groups is not equivalent (chi-square = , p < .001). Table 3: Gender Distribution of Self and Observers Gender Self Observer N % N % Females 1204 4597 Males 724 3230 Chi-square = , p < .001 Table 4 shows the distribution of respondents by ethnicity, using respondents only from the United States. Just over two-thirds of the respondents for both Self and Observer response categories identify their ethnicity as White/Caucasian. Among Self respondents about 10 percent are Asian/Pacific Islanders, nearly 9 percent are Black/African American, about 8 percent are Hispanic, less than one percent are Native American, and 5 percent indicate Other.
8 Among Observer respondents about 12 percent are Asian/Pacific Islanders, nearly 5 percent are Black/African American, about 8 percent are Hispanic, 1 percent are Native American, and almost 7 percent indicate Other. Chi-square analysis reveals that the distributions by ethnicity are not equivalent among these two groups (chi-square = , p < .001). Table 4:Ethnic Distribution of Self and Observers Ethnicity Self Observer N % N % Asian/Pacific Islander 133 647 Black/African American 112 283 Hispanic 105 434 Native American 8 55 White/Caucasian 870 3604 Other 69 351 Chi-square = , p < .001 5 Table 5 shows the distribution of respondents by their answer to the question: What is your country of origin or region of residence? The majority of respondents in both samples (59%) indicated the United States.
9 Respondents outside the came from 60 different countries, and for purposes of this analysis were combined to form an Outside the category. Chi-square analysis reveals that the distributions among and Outside the respondents is the same for these two groups (chi-square = , p = ). Table 5: Distribution of United States and Outside the Self and Observer Respondents Nationality Self Observer N % N % United States 1135 4624 Outside the 788 3185 Chi-square = , p = leadership Characteristics of Sample Self respondents were asked three questions which (a) provided an assessment of their leadership skills compared to their peers, and indicated (b) the number of instances they had been a leader and (c) the extent they had participated in formal leadership development education. As shown in Table 6, in terms of their self-assessment, over two-thirds indicated that their leadership skills were somewhat developed ( ) or well developed ( ).
10 Another 21 percent were equivocal about their leadership skills compared to their peers by selecting the response similar with my peer group. About 8 percent responded that their leadership skills were somewhat underdeveloped and the remaining respondents (less than 1%) indicated not well developed. The data in Table 7 shows that on the question about How many opportunities have you had to be a leader? most respondents replied affirmatively. Only a handful ( ) said that they had not had any opportunity to be a leader, 14 percent indicated that they had a few opportunities, with the most frequent response being several ( ), followed by 6 some ( ) and many ( ). Table 8 shows how leaders (Self) responded to the question of how many formal development opportunities in leading and/or leadership ( , a class, workshop, seminar, book, coaching, etc.) have you had? There were no responses in either the none or many category (the two end points of the scale).