Transcription of Quantification of Thermo Scientific K-Alpha Data
1 Copyright 2008 Casa Software Ltd. Quantification of Thermo Scientific K-Alpha Data The last ten years have seen the XPS technique develop from a technique used predominantly by experts of XPS to a tool used by application oriented scientists. The emergence of instruments such as the Thermo Scientific K-Alpha shows that there is a place for an instrument with a high performance to cost ratio and lower cost of ownership. Instruments with these characteristics offer a route for the XPS technique into application areas previous limited by the constraints of expensive high performance technology. There will always be a place for high performance systems run by experts, but these new low cost XPS systems can only be good for surface science.
2 The data from the Thermo Scientific K-Alpha is supported in version of CasaXPS, where a number of enhancements are included to streamline the conversion and processing of the new ASCII files. The ASCII files exported from the K-Alpha include a new flag to indicate whether or not the intensities are corrected for transmission. Version of CasaXPS detects the new flag and converts the ASCII file to the ISO 14796 format using the counts per bin computed from the transmission corrected data. The necessity of returning the data to counts per bin lies in the assumption that the noise in the data is governed by Poisson statistics, which is required when measuring the goodness-of-fit for and when performing Monte Carlo error analysis on peak models.
3 The ISO file written by CasaXPS includes both the counts-per-bin and also the transmission functions from the ASCII file, therefore Quantification of the spectra in CasaXPS proceeds exactly the same way as for other data acquired using the Thermo Avantage data system. An attractive feature of the K-Alpha is the possibility of combining a new resource with existing high performance instruments, either in-house or available from external laboratories. To accommodate the use of more than one instrument, data converted from a K-Alpha have a unique source label assigned to each VAMAS block and hence entries specific to the K-Alpha can be added to the CasaXPS element library. This feature permits the default CasaXPS library to offer the appropriate RSFs for data from different instruments.
4 A new toolbar button provides a further means of creating Quantification regions for a set of VAMAS blocks based on the element/transition fields in the VAMAS blocks. When converted from the Avantage ASCII files, the spectra are assigned the element/transition fields based on the name assigned to the data. For example, a carbon 1s transition might appear in the Avantage data file with the name C 1s Scan or C 1s Snap , depending on the acquisition mode. On conversion to ISO format through CasaXPS, these strings are used to extract the element C and transition 1s . Armed with these strings, the new toolbar button identifies the entry corresponding to the photoelectric line in the element library and uses the element library information to create regions for each selected VAMAS block correctly assigned in terms of element/transition.
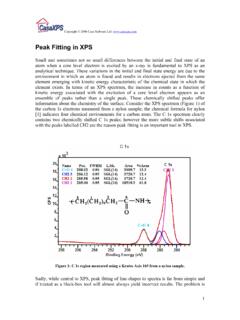
5 1 Copyright 2008 Casa Software Ltd. Thermo Scientific K-Alpha XPS Instrument 2 Copyright 2008 Casa Software Ltd. Thermo Scientific Avantage Files Converting K-Alpha Data The Avantage binary files must be converted via an Avantage utility program ( ) to ASCII equivalent files. These ASCII files are created with the file extension .avg and can be converted to ISO 14976 (VAMAS) format using the Convert to VAMAS dialog window available from the File menu or the top toolbar of CasaXPS: Data from the K-Alpha are exported from the Avantage system as ASCII file. The exported data files appear as shown in Figure 1. These ASCII files can be converted as follows. 1. Using the Avantage utility program , convert all the.
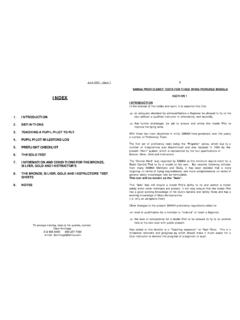
6 Vgd binary files for an experiment to .avg ASCII files. 2. Select the Convert to VAMAS dialog window in CasaXPS either using the toolbar button or via the Convert menu item on the File menu. 3. Move to the directory containing the .avg ASCII files; the program offers the user the choice of where the ASCII files should be created. 4. Enter a name for the new VAMAS file using the file extension .avg and press the Open button. For example, if you wish to call your new file , then you should enter into the file name field on the Convert to VAMAS file dialog window. Each .avg file found in the current directory will be read and entered into the new VAMAS file named An example showing how to convert a directory of ASCII files can be seen in Figure 2, where a new ISO file named Figure 1: Data file exported from Avantage.
7 3 Copyright 2008 Casa Software Ltd. will be created from the set of avg files in the current directory Scan_0. Note how the base-name for the ISO file is used together with the .avg conversion switch to instruct the set of .avg files in the directory to be read and then converted to the ISO format. Figure 3: The ISO file converted from the data files in Figure 2. Merging Sets of Experiments Figure 2: Convert to VAMAS Dialog illustrating a directory of ASCII avg files. The acquisition regions for each experiment are exported into separate ASCII files with the .avg extension, thus an experiment is typically recorded, once exported, as a set of ASCII files in a directory. If an experiment is one in a sequence of experiments, all of which might reasonably be processed as a unit, then a further import option allows a set of such data directories to be converted to a single ISO 14976 VAMAS file.
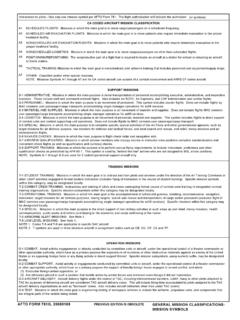
8 The ISO file converted from the data files in Figure 2 is shown in Figure 3. Each avg file in Figure 2 contained two spectra per file, before and after etching the sample surface, hence the two rows of VAMAS blocks in the file in Figure 3. 4 Copyright 2008 Casa Software Ltd. Figure 4: Merging data from two directories using the .mvg conversion switch. Given a set of directories each containing exported Avantage data, a new VAMAS file is created by moving to the directory (using the Convert to VAMAS File Dialog, Figure 4) containing these data sub-directories and entering the new filename with an extension of .mvg. A VAMAS file with the extension .vms, shown in Figure 5, is created at the level of the directory containing the data sub-directories.
9 The .avg files found in the sub-directories are converted and entered into the new VAMAS file with the experimental variable set to a Data Set index number; the index assigned to the experimental variable is dependent on the order of the sub-directories when read. In addition to the Data Set index, the rows are also assigned labels based on the names given to the sub-directories, which can be view using the Edit Mode toolbar button. Figure 5: Single ISO file created using the .mvg conversion switch acting on the two directories in Figure 4. 5 Copyright 2008 Casa Software Ltd. Quantification The principal features used to quantify data from the K-Alpha can be discussed using survey spectra. Figure 6: Survey spectrum from a steel standard. 6 Copyright 2008 Casa Software Ltd.
10 Element Library Excitation Source String Figure 6 is a survey spectrum measured using a K-Alpha instrument, exported to ASCII format and converted to ISO format using CasaXPS. The header above the spectrum in Figure 6 includes the source string assigned by CasaXPS to the aluminium anode, namely, KA1486. The significance of the unique source string assignment for the K-Alpha data is that the KA1486 string allows a set of element library entries to be prepared for use with the K-Alpha data. When a spectrum is displayed in the active tile in CasaXPS, the element library entries visible on the Element Table property page shown in Figure 7 are selected based on a match between the source string stored in the VAMAS block for the spectral data and the Excitation Source string located in the element library file.