Transcription of XPS Spectra - casaxps.com
1 Copyright 2013 Casa Software Ltd. 1 XPS Spectra The XPS technique is used to investigate the chemistry at the surface of a sample. Figure 1: Schematic of an XPS instrument. The basic mechanism behind an XPS instrument is illustrated in Figure 1. Photons of a specific energy are used to excite the electronic states of atoms below the surface of the sample. Electrons ejected from the surface are energy filtered via a hemispherical analyser (HSA) before the intensity for a defined energy is recorded by a detector. Since core level electrons in solid-state atoms are quantized, the resulting energy Spectra exhibit resonance peaks characteristic of the electronic structure for atoms at the sample surface.
2 While the x-rays may penetrate deep into the sample, the escape depth of the ejected electrons is limited. That is, for energies around 1400 eV, ejected electrons from depths greater than 10nm have a low probability of leaving the surface without undergoing an energy loss event, and therefore contribute to the background signal rather than well defined primary photoelectric peaks. In principle, the energies of the photoelectric lines are well defined in terms of the binding energy of the electronic states of atoms. Further, the chemical environment of the atoms at the surface result in well defined energy shifts to the peak energies.
3 In the case of conducting samples, for which the detected electron energies can be referenced to the Fermi energy of the spectrometer, an absolute energy scale can be established, thus aiding the identification of species. However, for non-conducting samples the problem of energy calibration is significant. Electrons leaving the sample surface cause a potential difference to exist between the sample and the spectrometer resulting in a retarding field acting on the electrons Copyright 2013 Casa Software Ltd. 2 escaping the surface. Without redress, the consequence can be peaks shifted in energy by as much as 150 eV.
4 Charge compensation designed to replace the electrons emitted from the sample is used to reduce the influence of sample charging on insulating materials, but nevertheless identification of chemical state based on peak positions requires careful analysis. XPS is a quantitative technique in the sense that the number of electrons recorded for a given transition is proportional to the number of atoms at the surface. In practice, however, to produce accurate atomic concentrations from XPS Spectra is not straight forward. The precision of the intensities measured using XPS is not in doubt; that is intensities measured from similar samples are repeatable to good precision.
5 What may be doubtful are results reporting to be atomic concentrations for the elements at the surface. An accuracy of 10% is typically quoted for routinely performed XPS atomic concentrations. For specific carefully performed and characterised measurements better accuracy is possible, but for quantification based on standard relative sensitivity factors, precision is achieved not accuracy. Since many problems involve monitoring changes in samples, the precision of XPS makes the technique very powerful. The first issue involved with quantifying XPS Spectra is identifying those electrons belonging to a given transition.
6 The standard approach is to define an approximation to the background signal. The background in XPS is non-trivial in nature and results from all those electrons with initial energy greater than the measurement energy for which scattering events cause energy losses prior to emission from the sample. The zero-loss electrons constituting the photoelectric peak are considered to be the signal above the background approximation. A variety of background algorithms are used to measure the peak area; none of the practical algorithms are correct and therefore represent a source for uncertainty when computing the peak area.
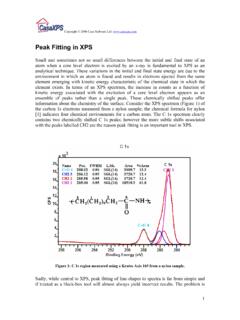
7 Peak areas computed from the background subtracted data form the basis for most elemental quantification results from XPS. Figure 2: An example of a typical XPS survey spectrum taken from a compound sample. Copyright 2013 Casa Software Ltd. 3 The data in Figure 2 illustrates an XPS spectrum measured from a typical sample encountered in practice. The inset tile within Figure 2 shows the range of energies associated with the C 1s and K 2p photoelectric lines. Since these two transitions include multiple overlapping peaks, there is a need to apportion the electrons to the C 1s or the K 2p transitions using a synthetic peak model fitted to the data.
8 The degree of correlation between the peaks in the model influences the precision and therefore the accuracy of the peak area computation. Relative sensitivity factors of photoelectric peaks are often tabulated and used routinely to scale the measured intensities as part of the atomic concentration calculation. These RSF tables can only be accurate for homogenous materials. If the sample varies in composition with depth, then the kinetic energy of the photoelectric line alters the depth from which electrons are sampled. It is not uncommon to see evidence of an element in the sample by considering a transition at high kinetic energy, but find little evidence for the presence of the same element when a lower kinetic energy transition is considered.
9 Transitions of this nature might be Fe 2p compared to Fe 3p both visible in Figure 2, where the relative intensity of these peaks will depend on the depth of the iron with respect to the surface. Sample roughness and angle of the sample to the analyser also changes the relative intensity of in-homogenous samples, thus sample preparation and mounting can influence quantification values. Figure 3: Germanium Oxide relative intensity to elemental germanium measured using photoelectrons with kinetic energy in the range 262 eV to 272 eV. Figure 4: Germanium Oxide relative intensity to elemental germanium measured using photoelectrons with kinetic energy in the range 1452 eV to 1460 eV.
10 Copyright 2013 Casa Software Ltd. 4 The chemical shifts seen in XPS data are a valuable source of information about the sample. The Spectra in Figure 3 and Figure 4 illustrate the separation of elemental and oxide peaks of germanium due to chemical state. Both Spectra were acquired from the same sample under the same conditions with the exception that the ejected electrons for the Ge 3d peaks are about 1200 eV more energetic that the Ge 2p electrons. The consequence of choosing to quantify based on one of these transitions is that the proportion of oxide to elemental germanium differs significantly.