Transcription of Real world evidence and analytical use cases - NCHICA
1 Copyright SAS Institute Inc. All rights world evidence and analytical use casesYang Xiao & David SAS Institute Inc. All rights Introduction RWE use cases and applications analytical use case 1: CharlsonComorbidity Index and risk score analytical Use case 2: Incident and prevalent cases analysis Questions & DiscussionsCopyright SAS Institute Inc. All rights is real world data (RWD) and real world evidence (RWE)? RWD is Big data ; RWD is not just Big Data . RWD is the integration of multiple sources of data. RWE can find patterns, generate key conclusions and insights. RWE is a proof of meaningful use of , testEMRS ocial mediaConsumer dataRCTP harmacy dataPatient registryClaims dataCopyright SAS Institute Inc. All rights to current Use of patient outcomes data in medical evidence for many years.
2 Observational studies using insurance claims and/or EMR data. Drug Safety Surveillance. Health economics and outcomes research (HEOR). Value optimization and risk mitigation. Population Health Analytics and SAS Institute Inc. All rights development areas Understanding of the efficacy of medical treatments: Comparing treatment effectiveness Negotiating drug prices based on outcomes Increasing patient medication adherence Common data model: Observational Health Data Sciences and Informatics (OHDSI) The FDA Mini-Sentinel Program The National Patient Centered clinical Research Network (PCORnet)Copyright SAS Institute Inc. All rights Pillars of Real world EvidenceManagement of data assets01 Identifying patient cohorts of interest02 Knowledge and insights via analytics03 Copyright SAS Institute Inc.
3 All rights and future Standards-Based, Efficient, and Democratized ecosystem. Open, Transparent, and Collaborative. Internet of things (IOT) measures various aspects of patient health more and more data. Block chain technologywill enable the secure storage of patient health data and the direct transmission of anonymized data to Pharmaceutical companies. Cognitive computingwill enable deeper insights to be gained from the stores of RWE SAS Institute Inc. All rights world evidence ApplicationsCopyright SAS Institute Inc. All rights world evidence Process FlowCopyright SAS Institute Inc. All rights SAS Institute Inc. All rights SAS Institute Inc. All rights SAS Institute Inc. All rights SAS Institute Inc. All rights SAS Institute Inc.
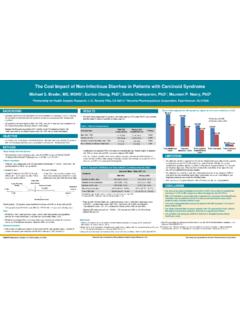
4 All rights SAS Institute Inc. All rights SAS Institute Inc. All rights SAS Institute Inc. All rights SAS Institute Inc. All rights SAS Institute Inc. All rights SAS Institute Inc. All rights SAS Institute Inc. All rights SAS Institute Inc. All rights SAS Institute Inc. All rights SAS Institute Inc. All rights SAS Institute Inc. All rights Index (CCI)Description The Charlsoncomorbidity indexpredicts the one-year mortality for a patient who may have a range of comorbid conditions, such asheart disease,AIDS, orcancer(a total of 22 conditions). Each condition is assigned a score of 1, 2, 3, or 6, depending on the risk of dying associated with each one. Scores are summed to provide a total score to predict mortality.
5 Many variations of the Charlsoncomorbidity index have been presented, including the Charlson/Deyo, Charlson/Romano, Charlson/Manitoba, and Charlson/D'Hoorescomorbidity indices. For a physician, this score is helpful in deciding how aggressively to treat a condition. A questionnaire for patients to answer or chart review by nurse to determine whether a particular condition was present in order to calculate the index. Administrative data such as claims data of the source of real world data can derive CCI and scores as predictors in statistical analysis. The Charlsonindex, especially the Charlson/Deyo, followed by the Elixhauserhave been most commonly referred by the comparative studies of comorbidity and SAS Institute Inc. All rights Index (CCI)Backgroud Originally developed by Charlsonet al.
6 (1987) A new method of classifying prognostic comorbidity in longitudinal studies:developmentand validation. 19 categories of comorbidity and weights (1-6) were identified based on the adjusted relative risk of one-year mortality. CharlsonComorbidity Score (CCS) is derived by summing up each individual SAS Institute Inc. All rights Index (CCI)More development Deyoet al. (1992) published adapting a clinical comorbidity index for use with ICD-9-CM administrative databse . Two of the categories Leukemia and Lymphomas from Charlsonet al.(1987) were combined into one category Any Malignancy . Total of 17 categories. Halfonet al.(2002) translated to ICD-10 and developed weights in their publication Measuring potentially avoidable hospital readmissions.
7 Quanet al.(2005) followed Deyo scoding algorithm to develop Charlsonand Elixhausercomorbidities in Coding algorithm for defining comorbidities in ICD-9-CM and ICD-10 administrative data .Copyright SAS Institute Inc. All rights Index (CCI)Comparison and validation A table compared Halfon sand Quan stranslations of the CCI using ICD-10 codes: (link) Sundararajan et al.(2007) compared performance of three versions of the ICD-10 CCI coding and found all performed well. Li et al.(2008) assessed performance of the CCI and ElixhauserComorbidity Index between ICD-9 and ICD-10 coding system in Risk adjustment performance of Charlsonand Elixhausercomorbidities in ICD-9 and ICD-10 administrative databases. Sharbaianie al.(2012) reviewed 54 articles to compare Charlson, Elixhauser, and their variants performance for different patient group and outcome.
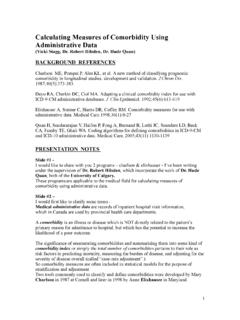
8 In "Systematic review of comorbidity indices for administrative data . Austin el al.(2015) provide an proof of the utility of comorbidity summary in Why summary comorbidity measures such as the CharlsonComorbidity Index and Elixhauserscore work using SEER-Medicare SAS Institute Inc. All rights Index (CCI)Notes and limitations Include or exclude complication diagnosis code? Developed via hospital abstracts data using the most granular level of ICD-9 and ICD-10 codes. Using only 3-digit ICD codes is not SAS Institute Inc. All rights scores exploration and comparisonCopyright SAS Institute Inc. All rights scores exploration and comparisonCopyright SAS Institute Inc. All rights Risk Scoring capabilities that provide a holistic depiction of member health.
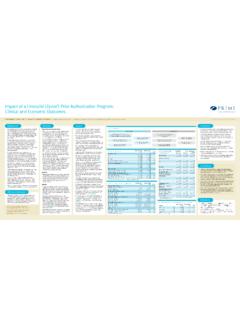
9 Unlike the calculation of one Risk Score for each member, the calculation of Risk Scores by disease state allows organizations to better understand and serve the medical needs of each SAS Institute Inc. All rights and prevalent cases analysisDefinition Incidence: The occurrences of new cases of a disease or condition in a population over a specified period of time, typically one year. Incident population: newly identified patients. Incident population example: Those who are diagnosed with chronic conditions during the period, or Those who joined the health plan during the period with existing chronic conditions prior to enrollment. Prevalence: A measurement of the total number of cases of a disease in a population at a given time, usually given as the proportion of affected people in the population.
10 Prevalent population: patients identified before study start date or index event SAS Institute Inc. All rights and prevalent cases analysisQuestions and results Sample questions: Create a cohort with newly diagnosis of diabetes Create a cohort with newly use of a drug Results: Summary statistics and incident rate. Standardized rates adjusted for demographic SAS Institute Inc. All rights and prevalent cases analysisSummary reportCopyright SAS Institute Inc. All rights and prevalent cases analysisSummary report