Transcription of Remote Sensing Applications in Agriculture at the …
1 Remote Sensing Applications in Agriculture at the usda national agricultural statistics Service Jeffrey T. Bailey Chief of Geospatial Information Branch Research and Development Division United States Department of Agriculture national agricultural statistics Service 3251 Old Lee Highway Fairfax, VA 22030 (USA) Claire G. Boryan Geographer Research and Development Division United States Department of Agriculture national agricultural statistics Service 3251 Old Lee Highway Fairfax, VA 22030 (USA) Date: September 20, 2010 ABSTRACT The United States Department of Agriculture s ( usda ) national agricultural statistics Service (NASS) has researched and used Remote Sensing technology for acreage estimation since the early 1970s.
2 Significant advancements in recent years have enabled NASS to transition the use of Remote Sensing from primarily a research function to performing an integral role in the agency s crop acreage estimation program covering all major crops grown in high producing states in the This accomplishment was achieved in large part as a result of 1) enhanced data partnerships, 2) improved methodologies, 3) increased availability of commercial software, and 4) improved imagery and ancillary data. With acreage estimation now operational, the Agency is focusing its efforts to transition yield estimation from research to operational, as well. Currently corn and soybean yield estimates for 10 major producing states are provided in-season to the agricultural Statistic Board (ASB) and the NASS field offices. Although, yield estimates are solid, with more experience and research, improvements are expected. Looking to the future, NASS has begun conducting research to quantitatively measure crop progress and condition using Remote Sensing and intends to expand the use of Remote Sensing into mapping soil moisture and improving disaster assessments and monitoring.
3 Key Words: Cropland Data Layer, Remote Sensing , Satellite Imagery, Agriculture BACKGROUND The mission of the national agricultural statistics Service (NASS), an agency of the United States Department of Agriculture ( usda ) is to provide timely, accurate and useful statistics in service to US Agriculture . Towards this goal, NASS conducts hundreds of surveys every year collecting information on virtually every aspect of agricultural activity. In 2010, the NASS Cropland Data Layer (CDL) Program played an important role toward fulfilling this mission using Remote Sensing techniques to provide operational in-season acreage estimates to the NASS agricultural statistics Board (ASB) and Field Offices (FOs) for twenty seven states and sixteen crops. NASS initiated its Remote Sensing acreage estimation program, in the 1970s and early 1980s, with the Large Area Crop Inventory Experiment (LACIE) and Agriculture and Resources Inventory Surveys through Aerospace Remote Sensing (AgRISTARS) to determine if crop acreage estimates could be derived using multispectral imagery and ground truth data.
4 These programs were successful at generating unbiased statistical estimates of crop area at the state and county level and more importantly reducing the statistical variance of acreage indications from farmer reported surveys (Craig, 2009). NASS Remote Sensing acreage estimation program evolved over the years paving the way for the current CDL program which has been in existence since 1997. Originally an in-house Remote Sensing and estimation software known as Peditor, Landsat satellite imagery, and NASS survey data were used to produce the CDL image products and acreage estimates. NASS and the University of Illinois Center for Advanced Computing developed a customized program called Editor. It was transferred to other computer platforms by NASS and the name was modified to Peditor. The historic Peditor method delivered state and county level estimates in late December for the Crop Production Annual Summary (Craig, 2009).
5 Beginning in 2006, the CDL program underwent a major restructuring and modernization effort. The original software and data inputs were replaced with a commercial suite of software including Rulequest Research s See5 decision tree software, ERDAS Imagine Remote Sensing software, Environmental Systems Research Institute s (ESRI) ArcGIS, Statistical Analysis Software (SAS), Resourcesat-1 Advanced Wide Field Sensor (AWiFS) data, and Common Land Unit (CLU) data from the Farm Service Agency (FSA). Tremendous efficiency gains were achieved due to the modernization allowing for the generation of in-season crop acreage estimates, a goal never achieved using the older method. Recent Successes in Remote Sensing at NASS For the first time on January 10, 2010 NASS released a national Cropland Data Layer for 48 conterminous states. The CDL product is a comprehensive, raster, geo-referenced, crop-specific land cover classification with a ground resolution of 56 meters, which utilizes satellite imagery, to accurately locate and identify field crops.
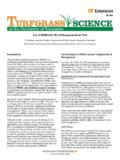
6 Geographic Information System (GIS) data layers are valuable resources for government agencies, private sector organizations, scientists, educators and students that use land cover information for environmental, agricultural , business or research. Figure 1. 2009 Cropland Data Layers, Released January 11, 2010. CDL products have been used in a variety of research Applications ranging from assessing the utility of 500m MODIS Time-Series Data for mapping corn and soybean in the (Chang et al., 2007), validating plant functional type maps developed from MODIS data using multisource evidential reasoning (Sun, et al., 2008), examining the relationship between agricultural chemical exposure and cancer (Maxwell, et al., 2010), to flood mapping assessment with satellite images (Shan, et al., 2010). The CDL was also used to assess the utility of monitoring tree cover in agricultural landscapes in North and South Dakota using high resolution aerial imagery (Liknes, et al.)
7 , 2010) and to assess automated determination of management units for precision soil conservation (Gelder, et al., 2008). Using the CDL as the foundation, NASS runs a regression estimator to produce crop acreage estimates. Beginning in 2007 NASS was able to generate in-season acreage estimates for the first time. Previously, acreage estimates could only be derived at the end of the crop season. Currently, winter wheat acreage estimates are provided to the NASS ASB and the field offices beginning in June. Acreage estimates for corn, soybeans and other crops are generated in August, September and October. In 2007, estimates were provided for six crops in 12 states. The program has expanded to the point that in 2010 NASS produced estimates at the state level for 16 different crops in 27 states. In addition, post season small area estimates will be provided for 36 states. Again using the CDL as the foundation, NASS provided operational in-season corn and soybean yield estimates to the NASS ASB and field offices for the past two years.
8 In 2009 NASS calculated corn and soybean yield estimates for 6 states. In 2010, NASS anticipates providing yield estimates for 10 states. Additionally at the end of the year, NASS will provide small area yield estimates to be used operationally in the county estimates program. With additional research, NASS anticipates expanding the yield estimation program to include additional states and crops. Currently, the remotely sensed Normalized Difference Vegetative Index (NDVI) is the sole input to the yield models. Additional inputs related to weather and soils are being explored with the anticipation of increasing the accuracy of the yield predictions. Critical Components for Remote Sensing The first critical component for any Remote Sensing program is solid ground truth information. Without ground data to identify land cover categories, to train the classifier and validate the output image products, it is impossible to run a defensible program that provides reliable results.
9 Ground truth is mentioned first, because it must be seriously considered before initiating plans for any Remote Sensing application. Secondly, a source of satellite imagery is required. There are many sources of satellite imagery which vary considerably in cost, as well as, spatial, temporal, spectral and radiometric resolution. Finding an imagery source that also provides a guarantee of future continuity is an important consideration, since once a program has been researched and implemented, it becomes more difficult to transition to another satellite. Thirdly, using remotely sensed data requires a sizable investment in Information Technology (IT) resources. However, with the speed of computers continuing to increase and the price of disc storage on the decline this has become much less of a hindrance. Ground Truth NASS has two sources of field level crop information for ground truth, its own June Area Survey (JAS) and the usda Farm Service Agency (FSA).
10 NASS collects the June Area Survey (JAS) segment data and the FSA collects CLU polygon data. The scope of the FSA CLU program is comprehensive including all states and extensive coverage of major crops. The program is run at the county level in over 2,300 FSA county offices. There are two important differences between JAS and FSA data, as ground truth, in the CDL program. First, the JAS data requires manual digitization of individual segments by NASS staff or cooperators while the FSA data does not. The individual polygon boundaries of the JAS segments are regularly digitized to support the survey but the individual fields within each segment require additional digitization. The FSA CLU polygon data are digitized and crop specific attribute data collected in the FSA county offices as part of a standardized GIS layer that collects information on all fields in FSA programs on a near real time basis for compliance and administration purposes (Mueller et al.)