Transcription of Satrix Balanced Index Fund - sanlam.com
1 Advice fee | Any advice fee is negotiable between the client and their financial advisor. An annualadvice fee negotiated is paid via a repurchase of units from the this fund invests into other unit trusts, it does so into zero fee classes except for offshoreequity ( ) and offshore bonds ( ).Total Expense Ratio (TER) | The Total Expense Ratio (TER) is the charges incurred by theportfolio, for the payment of services rendered in the administration of the CIS. The TER isexpressed as a percentage of the daily NAV of the CIS and calculated over a period of 1 TER is calculated since inception from 01 April 2017 to 31 March 2018. A higher TER doesnot imply a poor return nor does a low TER imply a good Transaction Cost (TC) is the cost incurred by the portfolio in the buying and selling ofunderlying assets. This is expressed as a percentage of the daily NAV of the CIS and calculatedover a period of 1 year.
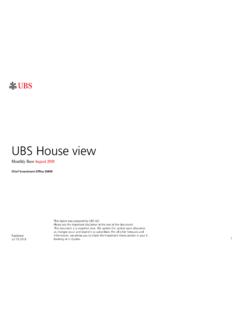
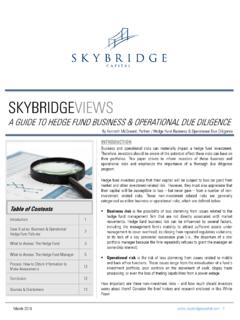
2 Obtain the costs of an investment prior to investing by using the EACcalculator provided at 10 HoldingsSecurities% of PortfolioNaspers / Price Group Group 10 Holdings as at 31 Jul 2018 Performance (Annualised) as at 31 Jul 2018 on a rolling monthly basisB1-ClassFund (%)Benchmark (%)Category (%)1 yearN/AN/AN/ASince return is the weighted average compound growth rate over the period (Cumulative) as at 31 Jul 2018 on a rolling monthly basisB1-ClassFund (%)Benchmark (%)Category (%)1 yearN/AN/AN/ASince return is aggregate return of the portfolio for a specified periodActual highest and lowest annual returns*Highest Annual % Balanced Index FundJuly 2018( fund Fact Sheet) fund ObjectiveThe Satrix Balanced Index fund is Regulation 28 compliant and offers diversifiedexposure to all the key local and international asset classes. The fund tracks acomposite Index benchmark, with a long term strategic asset allocation, rebalancedon a bi-annual basis in March and SeptemberFund StrategyThe composite benchmark of the fund comprises the following asset class buildingblocks:25% Proprietary Satrix Stable Dividend Index25% S&P SA Quality Index50% Proprietary Satrix Momentum IndexJSE All Bond IndexFTSE/JSE SA Listed Property Index Barclays SA Gov Inflation-Linked BondSA Nominal CashMSCI World Equity IndexAsset class Index exposures Smart SA equity core (55%) SA bonds (8%) SA property (6%) SA inflation-linked bonds (6%) IndexSA cash (5%) International equities (15%) International bonds (5%) Barclays Global Treasury IndexThe asset composition of the Index aims to target a CPI+ return over the choose this fund ?
3 The Smart SA Equity Core reflects the equity characteristics we feel are mostsignificant. The strength in combining portfolios of these different characteristics is thatthey perform predictably and reliably with one another providing a smootherand diversified performance experience. The international portion of the fund (20%) provides some rand-hedgeprotection. You gain access to a fund that aims to grow capital steadily, while providingincome over the medium to longer term. The high equity exposure gives you material exposure to an asset class that,though more volatile than others, usually delivers superior performance in thelong InformationASISA fund ClassificationSA - Multi-Asset - High EquityCategory BenchmarkSA - Multi-Asset - High Equity - MedianRisk profileModerate AggressiveBenchmarkProprietary Satrix Balanced IndexPortfolio launch dateOct 2013 Fee class launch dateOct 2013 Minimum investmentManual: Lump sum: R10 000 l Monthly: : No minimumPortfolio sizeR3 millionLast two distributions31 Dec 2017: cents per unit30 Jun 2018: cents per unitIncome decl.
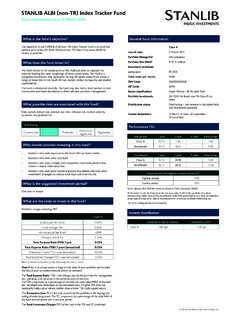
4 Dates30 June l 31 DecIncome price dates1st working day in July & JanuaryValuation time of fund17:00 Transaction cut off timeManual: 15 : 13:30 Daily price informationLocal newspaper and period3 working daysFees (Incl. VAT)B1-Class (%)Advice initial fee (max.)N/AManager initial feeN/AAdvice annual fee (max.) annual Expense Ratio (TER) Cost (TC) 1 This monthly Minimum Disclosure Document should be viewed in conjunction with the Glossary Terms Annual % Date: 22 Aug 2018 Asset Allocation Cash and Money Market Assets Inflation Linked Bonds International Assets Equities Property Manager(s) Quarterly Comment - 30 Jun 2018 Macro reviewIn the US, consumer confidence remained strong and retail sales data suggested arebound in consumption from a softer Q1. The unemployment rate also reached an18-year low of , accompanied by robust wage growth. As expected, the FederalReserve (Fed) raised the target for the federal funds rate by and marginallyincreased its 2018 forecasts for growth and inflation.
5 The positive economic datawere, however, Balanced by moves from the Trump administration to impose tariffson Chinese imports and withdraw from the Iran nuclear the Eurozone, the quarter was marked by the return of political risk. There wereconcerns that Italy could need fresh elections following the inconclusive outcome ofthe March vote, while Spain also saw a change of government, although this waslargely greeted with calm by markets. German Chancellor Angela Merkel clashedwith sister party the CSU over immigration policy. Economic data pointed to steadygrowth but at a slower pace than last year, as GDP growth for Q1 was , downfrom in Q4 2017. The European Central Bank (ECB) announced that it expectsto end its quantitative easing programme in December markets (EM) saw an escalation in global trade tensions which alsocontributed to risk aversion as US-China trade talks failed to deliver a sustainableagreement.
6 Brazil experienced a truck driver strike which paralysed the economyand amplified political uncertainty. Turkey saw currency weakness which forced thecentral bank to implement an emergency rate hike in May. China observed concernsover growth which contributed to Yuan and local market reviewGlobal developed market equities made gains in a volatile Q2, as resilient economicand earnings data vied with an unsettling geopolitical backdrop to establish themarket s direction. The MSCI World Index posted a positive Dollar total return ( for Q1), outperforming the MSCI EM Index ( in Q2 vs + inQ1). In the US, equities advanced in Q2 with the S&P 500 gaining in Dollars,with positive earnings momentum and supportive economic data ultimatelyoutshining escalating US-China trade posturing. Eurozone equities also postedpositive returns in Q2. In EMs, equities recorded a sharp fall with US Dollar strengtha significant headwind.
7 Worst performing countries were Brazil ( ), Turkey ( ) and Hungary ( ), while the only countries to post positive returns wereColombia (+ ) and Qatar (+ ).The SA equity market started June on a strong note, reaching a month-to-date totalreturn of by 14 June before reversing this to post a loss of by 26 FTSE/JSE All Share Index recovered on the last day of trade to record a Junetotal return of Large caps returned , while mid-caps and small caps and respectively. On a sector level, SA Resources was the bestperformer returning a solid (Q1: ). SA Industrials returned 4% (Q1: -8%)while SA Financials lost 6% (Q1: ).Global bond markets suffered from bouts of volatility in Q2 due to a confluence offactors. These included a greater dispersion between accelerating US growth and asoftening of economic activity elsewhere, escalating trade tensions between the USand China and the formation of a populist coalition government in Italy.
8 US 10-yearTreasury yields rose from to They rose significantly in April, touchinga seven-year high in mid-May, as growth and inflation expectations continued tobuild, before risk aversion and safe haven buying led to a significant , before risk aversion and safe haven buying led to a significant 10-year yields fell from to on safe haven demand and asEuropean data saw further softening. The Bloomberg Commodities Index posted aslightly positive return in Q2. Crude oil prices continued to rally, with PresidentTrump s decision to withdraw the US from the Iran nuclear accord contributing tohigher prices, despite OPEC announcing plans to boost supply. The industrialmetals Index registered a small :Global trade uncertainties and other geopolitical risks weighed heavilyon investor minds over the prior quarter. This resulted in a clear risk-off performanceof global styles.
9 While Low Risk, and in particular Low Beta, were the bestperforming factors, the cyclical factors such as Momentum and Growth did notcompletely roll over and instead only suffered from some mild rotation and profit-taking. In South Africa, there was large consistency with global outcomes, where wesaw factor reversals as the cyclical Price Momentum factor underperformed. Whatwas interesting, however, was how Earnings Momentum (a sub-component ofheadline Momentum) and Price Momentum exhibited divergent performances overthe quarter. As opposed to Price Momentum, Earnings Revisions came alive in Q2as investors gravitated towards companies with positive earnings sentiment. Thiscould be seen as investors viewing Earnings Revisions as a more defensivecomponent, which is aligned to how we utilise this factor in our overall :After a stellar 2017, underlying Quality factors, in particular Return onEquity (ROE), continue to experience strong signal strength during the first half ofthe year as investors favour stocks with defensive characteristics.
10 Global macroconcerns continue to weigh on risk appetites, which has compelled investors to seekcompanies that return high profits despite macro headwinds. This defensiveposturing has been present notwithstanding the largely pro-cyclical domesticsentiment, leadership optimism, declining risk of credit rating downgrade,improving inflation outlook. The conundrum, however, has been that during Q2, thissignal has been overwhelmed by stock-specific, sector and Rand risk in theportfolio. These impacts have significantly outweighed the Quality premiumembedded in the portfolio, as well as the valuation gap the Quality basket offersrelative to Dividend:After two consecutive very poor quarters, deep Value factors suchas Price to Book rekindled its 2016 performance where cyclical value was some extent the unwinding of Momentum has benefited these cyclical valuemeasures in the short term, however, should macro uncertainty continue anddeepen, we may see a shift towards more defensive Value or Quality to Book remains the worst performing strategy over 12 months.