Transcription of September 2000 NREL/TP-570-27715 1617 Cole Boulevard ...
1 September 2000 NREL/TP-570-27715 National Renewable Energy Laboratory1617 Cole BoulevardGolden, Colorado 80401-3393 NREL is a Department of Energy LaboratoryOperated by Midwest Research Institute Battelle BechtelContract No. DE-AC36-99GO10337 Cover Insert Photograph: Conoco Inc., 2000, All Rights Reserved. Legal, Privacy and Security Renewable Energy Laboratory1617 Cole BoulevardGolden, Colorado 80401-3393 NREL is a Department of Energy LaboratoryOperated by Midwest Research Institute Battelle BechtelContract No. DE-AC36-99-GO10337 September 2000 NREL/TP-570-27715 Life cycle Assessment of aNatural Gas combined -CyclePower Generation SystemPamela L.
2 SpathMargaret K. MannPrepared under Task No. report was prepared as an account of work sponsored by an agency of the United Statesgovernment. Neither the United States government nor any agency thereof, nor any of their employees,makes any warranty, express or implied, or assumes any legal liability or responsibility for the accuracy,completeness, or usefulness of any information, apparatus, product, or process disclosed, or representsthat its use would not infringe privately owned rights. Reference herein to any specific commercialproduct, process, or service by trade name, trademark, manufacturer, or otherwise does not necessarilyconstitute or imply its endorsement, recommendation, or favoring by the United States government or anyagency thereof.
3 The views and opinions of authors expressed herein do not necessarily state or reflectthose of the United States government or any agency electronically at for a processing fee to Department of Energyand its contractors, in paper, Department of EnergyOffice of Scientific and Technical Box 62 Oak Ridge, TN 37831-0062phone: : : for sale to the public, in paper, Department of CommerceNational Technical Information Service5285 Port Royal RoadSpringfield, VA 22161phone: : : ordering: on paper containing at least 50% wastepaper, including 20% postconsumer emissions (excluding CO2) (g/kWh)EXECUTIVE SUMMARYN atural gas accounts for 22% of all of the energy consumed in the United States.
4 It is used for steam andheat production in industrial processes, residential and commercial heating, and electric power , 15% of utility and non-utility power is produced from natural gas, while the Department ofEnergy s Energy Information Administration projects that 33% of the electricity generated in 2020 will befrom natural gas-fired power plants ( DOE, December 1998, ). Because of its importance in thepower mix in the United States, a life cycle assessment (LCA) on electricity generation via a natural gascombined- cycle (NGCC) system has been performed. In the near future, this study will be compared withLCAs for other electricity generation systems previously performed by NREL: biomass gasificationcombined- cycle , coal-fired power production, biomass cofiring in a coal-fired power plant, and direct-firedbiomass power generation (Mann and Spath, 1997; Spath and Mann, 1999; Mann and Spath, 2000; and Spathand Mann, 2000).
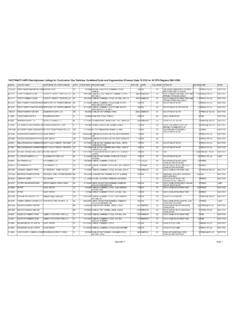
5 This will give a picture of the environmental benefits and drawbacks of these variouspower generation upstream processes can be significantly polluting, the application of LCA methodologies is importantfor gaining an understanding of the total environmental impact of a process. The system evaluated in thisstudy was divided into the following process steps: construction and decommissioning of the power plant,construction of the natural gas pipeline, natural gas production and distribution, ammonia production anddistribution for NOx removal, and power plant size of the NGCC power plant is 505 MW. The plant configuration consists of two gas turbines, a threepressure heat recovery steam generator, and a condensing reheat steam turbine .
6 To minimize the plant s NOxemissions, the power plant incorporates selective catalytic reduction (SCR) with water , the base case of this LCA assumes that of the gross natural gas that is extracted is lostto the atmosphere as fugitive emissions (Harrison et al, 1997).This study found that CO2accounts for 99 wt% of all airemissions. Methane is emittedin the next highest quantity,74% of which are fugitiveemissions from natural gasproduction and CO2 and CH4, thenext highest air emissions, inorder of decreasing amount,include non-methanehydrocarbons (NMHCs), NOx,SOx, CO, particulates, contributions from three greenhouse gases, CO2, CH4, and N2O, are considered in the assessment of theglobal warming potential (GWP) of the system.
7 According to the Intergovernmental Panel on ClimateChange (IPCC) the cumulative capacities of CH4 and N2O to contribute to the warming of the atmosphereare 21 and 310 times higher than CO2, respectively, for a 100 year time frame (Houghton, et al, 1996). TheGWP for this system is g CO2-equivalent/kWh. The following table contains the emission rates forthe different greenhouse gases and their contribution to the total of Greenhouse Gases and Contribution to GWPE missionamount(g/kWh)Percent ofgreenhouse gases inthis table (%)GWP relative to CO2(100 year IPCC values)GWP value(g CO2-equivalent /kWh)Percentcontributionto GWP (%) GWP of the system can also be divided among the different system operations.
8 The table below showsthe contribution of each subsystem to the overall GWP of the system. The power plant CO2 emissionscontribute the most to the GWP at 64%. Because of the natural gas lost to the atmosphere, the natural gasproduction and distribution subsystem is responsible for nearly all of the remainder of the system s Contribution For Each System ComponentProcess stepGWP value(g CO2-equivalent /kWh)Percent contributionto GWP (%)Power plant gas production & & production & : The construction and decommissioning subsystem includes power plant construction and decommissioning as wellas construction of the natural gas power plant efficiency for this NGCC system is (higher heating value (HHV) basis).
9 This isdefined as the energy to the grid divided by the energy in the natural gas feedstock to the power plant. Fourother types of efficiencies/energy ratios were defined to study the energy budget of the Efficiency and Energy Ratio DefinitionsLife cycle efficiency (%) (a)External energyefficiency (%) (b)Net energy ratio (c)External energy ratio (d)where: Eg = electric energy delivered to the utility gridEu = energy consumed by all upstream processes required to operate power plantEn = energy contained in the natural gas fed to the power plantEff = fossil fuel energy consumed within the system (e)(a) Includes the energy consumed by all of the processes.(b) Excludes the heating value of the natural gas feedstock from the life cycle efficiency formula.
10 (c) Illustrates how much energy is produced for each unit of fossil fuel energy consumed.(d) Excludes the energy of the natural gas to the power plant.(e) Includes the natural gas fed to the power plant since this resource is consumed within the boundaries of the net energy ratio is a more accurate measure of the net energy yield from the system than the externalenergy ratio because it accounts for all of the fossil energy inputs. The following table contains the resultingefficiencies and energy ratios for the NGCC system. All efficiencies are given on a LHV and Energy Ratio Results (LHV basis)SystemLife cycleefficiency(%)External energyefficiency(%)Net energyratioExternalenergy ratioNatural natural gas is not a renewable resource, the life cycle efficiency is negative, indicating that moreenergy is consumed by the system than is produced in the form of electricity ( , if the feedstock wererenewable then the life cycle efficiency and external energy efficiency would be the same).