Transcription of Setting and Measuring Quality Objectives - Ombu …
1 Setting and Measuring Quality Objectives The concept of Quality Objectives is very important to a Quality Management System (QMS), because it converts the broad statements of the Quality Policy into specific and concrete targets and actions. Solid Quality Objectives can help create an effective QMS. Medical Device Quality Management Systems The two most common medical device Quality management systems are 21 CFR Part 820, for use in the US, and ISO 13485:2003, an international standard. Many countries adopt ISO 13485:2003 as a national standard. One exception is the European Union's EN ISO 13485:2012 which documents some areas where the product directives and the international standard do not align.
2 However, none of misalignments involve the Quality policy or Quality Objectives . For FDA QSR, the requirement is in (a) Management responsibility Quality policy. Management with executive responsibility shall establish its policy and Objectives for, and commitment to, Quality . Management with executive responsibility shall ensure that the Quality policy is understood, implemented, and maintained at all levels of the organization.. For ISO 13485:2003, the basic requirements are in Clause Quality policy. Top management shall ensure that the Quality policy a) is appropriate to the purpose of the organization, b) includes a commitment to comply with requirements and to maintain the effectiveness of the Quality management system, c) provides a framework for establishing and reviewing Quality Objectives , d) is communicated and understood within the organization, and e) is reviewed for continuing suitability.
3 In addition, Planning Quality Objectives requires, The Quality Objectives shall be measurable and consistent with the Quality policy . Quality Policy The Quality Policy sets the stage for the Quality Objectives . A very simple Quality policy will illustrate the linkage. QSR, unlike ISO 13485:2003, doesn't have any requirements for the statement of the Quality Policy, so a very simple Quality Policy for Acme Widgets could be: Acme Widgets provides good stuff on time! Adding the additional requirements from ISO 13485:2003 we can expand the Quality Policy. Acme Widgets provides good stuff on time, complies with requirements, and maintains the effectiveness of the QMS!
4 Metrics Quality Objectives need to be measurable; an operational definition is a common tool. The metric helps communicate the Objectives to the employees and helps Management Review determine if they are successful. Quality Objectives commonly use three kinds of metrics. Effectiveness measures the ability of a process to achieve its intended result ISO 9000:2005, effectiveness means the extent to which planned activities are realized and planned results achieved Efficiency measures the resources required for a process to achieve its intended result ISO 9000:2005, efficiency means the relationship between the result achieved and the resources used Ombu Enterprises, LLC.
5 Setting and Measuring Quality Objectives Page 1 of 6. Cycle time measures the duration of a process to meet its intended result Setting Objectives Objective #1: Nonconformance rate in the plant (supports good stuff). Objective #2: Complaint rate for shipped products (supports good stuff). Objective #3: Complaint corrective action closure time (supports good stuff). Objective #4: On time delivery rate (supports on time). Objective #5: Requirement compliance rate (supports regulatory compliance). Objective #6: Regulatory compliance activity effort (supports regulatory compliance). Objective #7: Audit nonconformance rate (supports QMS effectiveness).
6 Objective #8: Audit nonconformance corrective action closure time (supports QMS effectiveness). Objective #9: Audit nonconformance corrective action closure effort (supports QMS effectiveness). The table below shows the metric type appropriate for each Objective. Metric Type Objective Effectiveness Efficiency Cycle time Nonconformance rate in the plant Yes Complaint rate for shipped products Yes Complaint corrective action closure time Yes On time delivery rate Yes Requirement compliance rate Yes Regulatory compliance activity effort Yes Audit nonconformance rate Yes Audit nonconformance corrective action closure time Yes Audit nonconformance corrective action closure effort Yes The sections below have a few representative examples.
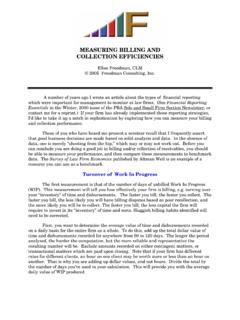
7 On Time Delivery Rate Increase the on-time delivery rate, based on promise date, linearly from 85% in January 2014 to 90% in December 2014. This is a measure of the effectiveness of the fulfillment processes This is a rate, so we need a numerator and a denominator Numerator: the number of sales order lines shipped on or before the promise date, p Denominator: the number of sales order lines shipped, s Value: (p/s) 100%. Frequency: calculate the metric for each calendar month Improvement direction: up, larger values are better Ombu Enterprises, LLC. Setting and Measuring Quality Objectives Page 2 of 6.
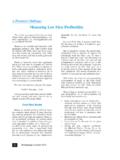
8 On Time Delivery Better P e rce n tag e o f S a le s O rd e r L in es Rate Target Jan Feb Mar Apr May Jun Jul Aug Sep Oct Nov Dec Month Complaint Corrective Action Closure Time Reduce the 95% percentile of the complaint closure time linearly from 45 calendar days in January 2014. to 30 calendar days in December 2014. This is a measure of the cycle-time of the Complaint Corrective Action process The metric is a characteristic of a distribution involving time, so we need to know how to calculate the times and the percentile For each complaint corrective action, determine the number of calendar days from the opening date of the CA to the closing date of the CA, the closure time set, c For the closure time set, determine the 95% percentile of the set Frequency: calculate the metric for each month Improvement direction.
9 Down, smaller values are better Closure times, especially in corrective actions, have a time distribution that usually has a long tail to the right. Ombu Enterprises, LLC. Setting and Measuring Quality Objectives Page 3 of 6. Distribution of Corrective Action Closure Times Median 95th Percentile Mean Days A line graph may be appropriate, as shown below. Closure Time Better 50. 45. 40. 35. 30. 95th Percentile Days 25. Target 20. 15. 10. 5. 0. Jan Feb Mar Apr May Jun Jul Aug Sep Oct Nov Dec Month A more complete picture, since there is an underlying distribution that can change over time, comes from a series of box plots.
10 However, box plots are difficult in Excel. The Hi-Low-Close graph can provide a good picture of the distribution changes. Ombu Enterprises, LLC. Setting and Measuring Quality Objectives Page 4 of 6. 60. Better 50. 40. Max Min 30. 95th Percentile Target 20. 10. 0. Jan Feb Mar Apr May Jun Jul Aug Sep Oct Nov Dec Audit nonconformance corrective action closure effort Reduce the 95% percentile of the audit nonconformance corrective action effort (total hours expended). linearly from 35 hours in January 2014 to 25 hours in December 2014. This is a measure of the efficiency of the Audit Nonconformance Corrective Action process The metric is a characteristic of a distribution involving hours worked, so we need to know how to calculate the times and the percentile For each audit nonconformance corrective action, determine the number of hours expended by all employees, h The set should be a 12-month window to ensure sufficient data for analysis.