Transcription of Simple Linear Regression Models
1 14-1 2008 Raj JainCSE567 MWashington University in St. LouisSimple Linear Simple Linear Regression ModelsRegression ModelsRaj Jain Washington University in Saint LouisSaint Louis, MO slides are available on-line at: ~jain/cse567-08/14-2 2008 Raj JainCSE567 MWashington University in St. of a Good of model of deviation of Intervals for Regression Intervals for Tests for verifying Regression Assumption14-3 2008 Raj JainCSE567 MWashington University in St. LouisSimple Linear Regression ModelsSimple Linear Regression Models !
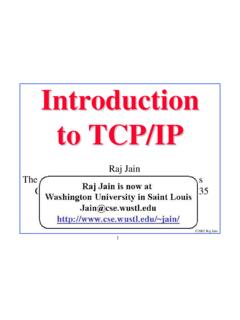
2 Regression model : Predict a response for a given set of predictor variables.!Response Variable: Estimated variable!Predictor Variables: Variables used to predict the response. predictors or factors! Linear Regression Models : Response is a Linear function of predictors. ! Simple Linear Regression Models : Only one predictor14-4 2008 Raj JainCSE567 MWashington University in St. LouisDefinition of a Good ModelDefinition of a Good ModelxyxyxyxyGoodGoodBad14-5 2008 Raj JainCSE567 MWashington University in St.
3 LouisGood model (Cont)Good model (Cont)! Regression Models attempt to minimize the distance measured vertically between the observation point and the model line (or curve).!The length of the line segment is called residual, modeling error, or simply error. !The negative and positive errors should cancel out Zero overall error Many lines will satisfy this 2008 Raj JainCSE567 MWashington University in St. LouisGood model (Cont)Good model (Cont)!Choose the line that minimizes the sum of squares of the errors.
4 Where, is the predicted response when the predictor variable is x. The parameter b0and b1are fixed Regression parameters to be determined from the data.!Given nobservation pairs {(x1, y1), .., (xn, yn)}, the estimated response for the ith observation is:!The error is:14-7 2008 Raj JainCSE567 MWashington University in St. LouisGood model (Cont)Good model (Cont)!The best Linear model minimizes the sum of squared errors (SSE):subject to the constraint that the mean error is zero:!This is equivalent to minimizing the variance of errors (see Exercise).
5 14-8 2008 Raj JainCSE567 MWashington University in St. LouisEstimation of model ParametersEstimation of model Parameters! Regression parameters that give minimum error variance are:!where,and14-9 2008 Raj JainCSE567 MWashington University in St. LouisExample !The number of disk I/O's and processor times of seven programs were measured as: (14, 2), (16, 5), (27, 7), (42, 9), (39, 10), (50, 13), (83, 20)!For this data: n=7, xy=3375, x=271, x2=13,855, y=66, y2=828, = , = Therefore,!
6 The desired Linear model is:14-10 2008 Raj JainCSE567 MWashington University in St. LouisExample (Cont)Example (Cont)14-11 2008 Raj JainCSE567 MWashington University in St. LouisExample 14. (Cont)Example 14. (Cont)!Error Computation14-12 2008 Raj JainCSE567 MWashington University in St. LouisDerivation of Regression ParametersDerivation of Regression Parameters!The error in the ith observation is:!For a sample of n observations, the mean error is:!Setting mean error to zero, we obtain:!Substituting b0 in the error expression, we get:14-13 2008 Raj JainCSE567 MWashington University in St.
7 LouisDerivation of Regression Parameters (Cont)Derivation of Regression Parameters (Cont)!The sum of squared errors SSE is:14-14 2008 Raj JainCSE567 MWashington University in St. LouisDerivation (Cont)Derivation (Cont)!Differentiating this equation with respect to b1and equating the result to zero:!That is,14-15 2008 Raj JainCSE567 MWashington University in St. LouisAllocation of VariationAllocation of Variation!Error variance without Regression = Variance of the responseand14-16 2008 Raj JainCSE567 MWashington University in St.
8 LouisAllocation of Variation (Cont)Allocation of Variation (Cont)!The sum of squared errors without Regression would be:!This is called total sum of squaresor (SST). It is a measure of y's variability and is called variationof y. SST can be computed as follows:!Where, SSY is the sum of squares of y(or y2). SS0 is the sum of squares of and is equal to .14-17 2008 Raj JainCSE567 MWashington University in St. LouisAllocation of Variation (Cont)Allocation of Variation (Cont)!The difference between SST and SSE is the sum of squares explained by the Regression .
9 It is called SSR:or!The fraction of the variation that is explained determines the goodness of the Regression and is called the coefficient of determination, R2:14-18 2008 Raj JainCSE567 MWashington University in St. LouisAllocation of Variation (Cont)Allocation of Variation (Cont)!The higher the value of R2, the better the Regression . R2=1 Perfect fit R2=0 No fit!Coefficient of Determination = {Correlation Coefficient (x,y)}2!Shortcut formula for SSE:14-19 2008 Raj JainCSE567 MWashington University in St.
10 LouisExample !For the disk I/O-CPU time data of Example :!The Regression explains 97% of CPU time's variation. 14-20 2008 Raj JainCSE567 MWashington University in St. LouisStandard Deviation of ErrorsStandard Deviation of Errors!Since errors are obtained after calculating two Regression parameters from the data, errors have n-2degrees of freedom!SSE/(n-2) is called mean squared errorsor (MSE). !Standard deviation of errors = square root of MSE. !SSY has ndegrees of freedom since it is obtained from nindependent observations without estimating any parameters.