Transcription of STANDING WAVES ON A STRING - City University of New …
1 Brooklyn College 1 STANDING WAVES ON A STRING Purpose a. To investigate resonance conditions for a vibrating STRING . b. To study dependence of wavelength on the tension and linear mass density of the STRING . Theory In any wave motion, wavelength ( ) and frequency (f) of the wave is related by fv (1) where v is the velocity of the propagation of the wave. The velocity, v of a wave on a stretched STRING depends on the tension, T, in the STRING and the mass per unit of the STRING , , and is given by Tv (2) If a stretched and vibrating STRING is clamped at both ends, like a guitar STRING , the wave reflects from the fixed ends and WAVES travel in both directions. The incident and reflected WAVES will combine according to superposition principle. When a proper amount of tension is applied along the STRING for a given length of the STRING , the WAVES travelling in opposite directions resonate and form a STANDING wave.
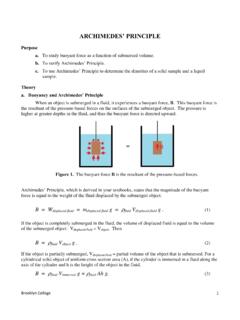
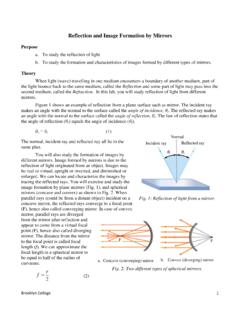
2 Figure 1 shows two of the many possible modes of making STANDING WAVES on a STRING . In the figures, N indicates the locations the STRING is stationary, called nodes, and A indicates the locations the STRING is vibrating with maximum amplitude, called antinodes. STANDING WAVES are discrete phenomena, meaning that they only occur at specific values of wavelength. The distance from a node to an adjacent node (or from an antinode to adjacent antinode) is half of the wavelength. In order to form a STANDING wave a resonance condition has to be satisfied: 2 nL (3) where L is the length of the STRING and n is an integer. For the STANDING wave in Figure 1a, the value of n is 1, and the wave pattern is called the fundamental or first harmonic. For Figure 1b, the value of n is 3, and the wave pattern is called the third harmonic.
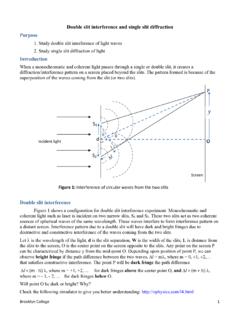
3 In this experiment you will use a vibrator of constant frequency to vibrate the STRING . Your investigations involve making resonances of different modes by adjusting the length and tension in two different strings. Apparatus Two strings (about 2 m length), 120-cycle electric vibrator and C-clamp; weight hanger, one 50 gram slotted weight, twelve 100 gram slotted weights, hand stroboscope, and triple-beam 1a. A first harmonic STANDING wave. harmonic. Figure 1b. A third harmonic STANDING wave. Brooklyn College 2 Description of Apparatus You will use a vibrator that consists of an electromagnet which causes a steel bar to vibrate at a fixed frequency of 120 Hz as shown in Figure 2a. The vibrator is clamped on a lab table. One end of the STRING is tied to the vibrating bar. The STRING is then passed over a light pulley wheel, and a weight hanger is attached to the other end.
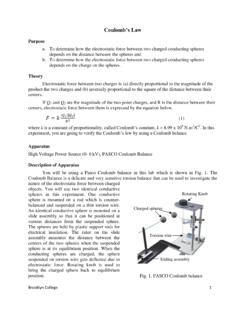
4 The weight on the hanger provides the tension in the STRING . You can slide the vibrator along the table, thus varying the length (L) of vibrating STRING . You will change the weight to change the tension in the STRING . A typical set up of this lab is shown in Figure 2b. When L is adjusted to approximately equal to a whole number of half-wavelengths, a resonant condition is set up in the STRING , and STANDING WAVES will be observed as shown in Figure 2. The distance D between adjacent nodes of the STANDING WAVES can be observed and measured, and is equal to one-half of the wavelength, . 2 D Procedure 1. Set the distance between the vibrating bar and the pulley to about 1 meter and clamp it loosely. 2. Tie one end of the heavier STRING to the vibrating bar and the other end to the weight hanger. Add slotted weights to give a total hanging mass of 600 grams.
5 3. Plug in the vibrator, loosen the clamp, and slowly slide the vibrator along the table ( , vary L) until a set of STANDING WAVES is formed. Note any change in the sound from the STRING as you near resonance. When a clear resonance pattern is observed with stable nodes and antinodes, clamp the vibrator to the table. 4. Count the number of nodes and draw the wave pattern (not including the ends of the STRING at the pulley and vibrating bar. They are not truly nodes) that appear along the STRING . Measure the distance between the first and last of these nodes. Divide this distance by the number of half-wavelengths observed to get your best estimate for D. Estimate the uncertainty in D. 5. In order to check whether your measurement of D is independent of the number of STANDING WAVES on the STRING , loosen the clamp and slide the vibrator until another resonant length is found.
6 Repeat Step 4. Do you get the same D, within your estimated uncertainty? 6. Change the hanging weight, and repeat Steps 3 and 4. (You do not have to repeat Step 5 for each weight.) Use total masses (M) of 200 grams, 400 grams, 800 grams 1000 grams, and 1200 grams for this STRING and find D for each load. 7. Unplug the vibrator, untie the heavier STRING , and weigh it on the balance. Then measure its length. Pay close attention to evaluating the uncertainty in these measurements. Compute from your measurements, and estimate its uncertainty. Figure 2a. Vibrator vibrating a STRING . Vibrator Clamp Vibrating STRING Figure 2b. Experimental set up. Brooklyn College 3 8. Now, use the lighter STRING , and follow the above procedure to generate another table of D vs. total hanging mass M. In the case of the lighter STRING , use hanging masses of 100 grams, 200 grams, 300 grams, and 400 grams.
7 Weigh the lighter STRING , and compute for it. 9. There should be a slotted disc ( hand stroboscope ) on your table that can be used to view the wave. Spin the stroboscope between your eye and the STRING so as to see the STRING through the slots at moments when the slots are horizontal. There will be instants when the STRING appears to be vibrating slowly enough to permit you to observe the relative phases of the adjacent antinodes. Explain your observation in your report. Computation and analysis The most obvious way to compare your experimental results with theory is to make a table of measured wavelengths meas using the fact that meas = 2D. In the tables for both strings, compare meas with the corresponding calculated values of the wavelength calc which you can obtain in terms of M, g, and from the equations already discussed.
8 A more comprehensive way to compare your data with theory comes from the fact that D2 should be proportional to M, the total mass of the hanging weight, for each STRING . From your data tables, make a graph of D2 vs. M. Try to get the data for both strings on the same graph, using different plotting symbols for the two different strings. Draw the best straight-line fit through the data for each STRING . Include the origin on your straight lines. Find the slope, S, of each line, and estimate the uncertainties in the slopes. What are the units of the slopes? From the equations discussed, find the theoretical expression of the slope in terms of g, , and vibrating frequency, f. Calculate the theoretical values of the slope from the known values of g, , and f. Make sure the formula for your slope has the same units as those of your graphical estimates.
9 Note that according to theory, S is inversely proportional to , so the product S should be same for both strings. What are the units of S ? This product is a good quantity to compare with theory, since S contains all the major uncertainties of the experiment, while its theoretical value involves only g and f, which are known constants of the experiment. Make this comparison with theory for both strings, and discuss any discrepancies in the context of observational uncertainties. Questions 1. Which of your values of meas are closest to calc in terms of percentage discrepancies, and which are farthest away? What do you think is the most likely reason for this in terms of the significant uncertainties in your measurements? Describe your procedure for estimating these uncertainties. 2. What does it mean to say that S is a more comprehensive way of comparing your experimental results with theory?
10 3. Why were you asked to include the origin in drawing the straight lines through your data points? How did you estimate the uncertainty in the slopes of your lines? 4. Why were you told not to count the two ends of the STRING as nodes when measuring D? 5. Why were you told to use different sets of hanging weights for the two different strings? 6. Describe your observations (with regard to both sound and sight) as you varied the length L, especially as you approached a resonance. 7. Another way of thinking of this experiment is as a measurement of gravitational acceleration g. Explain how this is true, and whether or not it is a good way of measuring g compared to other methods you know. Brooklyn College 4 Data Sheet Date experiment performed: Name of group members: a. For heavier STRING Mass of heavier STRING : Length of the heavier STRING : Table 1.