Example: barber
STAT 720 TIME SERIES ANALYSIS
STAT 720 TIME SERIES ANALYSIS Spring 2015 Lecture Notes Dewei Wang Department of Statistics University of South Carolina 1
Tags:
Information
Domain:
Source:
Link to this page:
Documents from same domain

STAT 730 Chapter 3: Normal Distribution Theory
people.stat.sc.eduSTAT 730 Chapter 3: Normal Distribution Theory Timothy Hanson DepartmentofStatistics,UniversityofSouthCarolina Stat730: MultivariateAnalysis 1/36. Nice properties of multivariate normal random vectors Multivariate normal easily generalizes univariate normal. Much harder to generalize Poisson, gamma, exponential, etc. ... (Chapter 2). ...

Density Curves and Normal Distributions
people.stat.sc.eduSTAT 110: Chapter 13 Hitchcock This area represents the proportion of all weights (in the population) that are between 100 and 200 pounds. 100 150 200 250 0.000 0.002 0.004 0.006 0.008 0.010 Possible density curve for the weight variable Weight Density This area = 0.84

3 Random vectors and multivariate normal distribution
people.stat.sc.edu3 Random vectors and multivariate normal distribution As we saw in Chapter 1, a natural way to think about repeated measurement data is as a series of random vectors, one vector corresponding to …

JAGS Version 4.3.0 user manual - University of South Carolina
people.stat.sc.edufrom source are given in a separate JAGS Installation manual. 1.2 Getting help The best way to get help on JAGS is to use the discussion forums hosted on Sourceforge at
JAGS Version 4.3.0 user manual - University of South Carolina
people.stat.sc.edu11 The dic module 64 11.1 Monitors in the dic module . . . . . . . . . . . . . . . . . . . . . . . . . . . . 64 11.1.1 The deviance monitor ...

Exploratory Factor Analysis - University of South Carolina
people.stat.sc.eduwell the variables load on the different factors. A factor is reliable if it has: 3 or more variables with loadings of 0.8 and any n 4 or more variables with loadings of 0.6 and any n 10 or more variables with loadings of 0.4 and n≥150 Factors with only a few loadings require n≥300

Posterior Predictive Distribution - University of South ...
people.stat.sc.eduPosterior Predictive Distribution I Recall that for a fixed value of θ, our data X follow the distribution p(X|θ). I However, the true value of θ is uncertain, so we should average over the possible values of θ to get a better idea of the distribution of X. I Before taking the sample, the uncertainty in θ is represented by the prior distribution p(θ).
Related documents
SPSS: Descriptive and Inferential Statistics
stat.utexas.edudescriptive statistics available, many of which are described in the preceding section. The example in the above dialog box would produce the following output: Going back to the Frequencies dialog box, you may click on the Statistics button to request additional descriptive statistics. Clicking on the Charts button produces the following box which

Probability and Statistics Vocabulary List (Definitions ...
online.math.uh.eduProb & Stat Vocab Probability and Statistics Vocabulary List (Definitions for Middle School Teachers) B • Bar graph – a diagram representing the frequency distribution for nominal or discrete data. It consists of a sequence of bars, or rectangles, corresponding to the possible values, and the
13 Determining the Sample Size - Department of Statistics
www.stat.columbia.eduA helpful tutorial on sample size issues is the paper by Steven Julious in Statistics in Medicine (Julious, 2004); a classic text is that of Desu and Raghavarao (1990). Nowadays, the use of specialist software for sample size determination such as NQuery, PASS or Power and Precision is common. We now consider the issues. 13.2 ISSUES

Logs In Regression - Statistics Department
www-stat.wharton.upenn.eduStatistics 621 Robert Stine Fall, 2001 5 as long as the changes are “small” relative to past values. Thus we have shown that on average, sales increase 3.4% per period. Logs as the Predictor and the Response In this case, the coefficient is known as an elasticity. Elasticities are described ...

3 Basics of Bayesian Statistics
www.stat.cmu.eduBasics of Bayesian Statistics Suppose a woman believes she may be pregnant after a single sexual encounter, but she is unsure. So, she takes a pregnancy test that is known to be 90% accurate—meaning it gives positive results to positive cases 90% of the time— and the test produces a positive result. 1 Ultimately, she would like to know the
BASIC CALCULUS REFRESHER
pages.stat.wisc.eduIsmor Fischer, Ph.D. Dept. of Statistics UW-Madison 1. Introduction. This is a very condensed and simplified version of basic calculus, which is a prerequisite for many courses in Mathematics, Statistics, Engineering, Pharmacy, etc. It is not comprehensive, and

Multiple Regression - Statistics at UC Berkeley
www.stat.berkeley.eduably enough, we can still solve this problem. Even better, a statistics package can find the coefficients of the least squares model easily. Here’s a typical example of a multiple regression table: Dependent variable is: Pct BF R-squared 5 71.3% R-squared (adjusted) 5 71.1% s 5 4.460 with 250 2 3 5 247 degrees of freedom

Missing-data imputation - Department of Statistics
www.stat.columbia.edu530 MISSING-DATA IMPUTATION 25.1 Missing-data mechanisms To decide how to handle missing data, it is helpful to know why they are missing. We consider four general “missingness mechanisms,” moving from the simplest to
1 Why is multiple testing a problem? - Statistics at UC ...
www.stat.berkeley.eduP(at least one signi cant result) = 1 P(no signi cant results) = 1 (1 0:0025)20 ˇ 0:0488 Here, we’re just a shade under our desired 0.05 level.
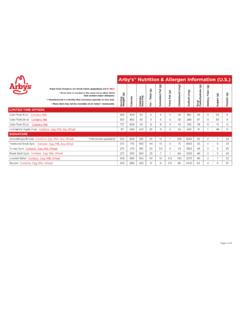
pjm†•uv Major food allergens are listed below underlined ...
cds.arbys.comMajor food allergens are listed below underlined and in RED. † * ® ^ ° ^ ° ^ ° ^ ° ^ ° ^ ° ^ ° ^ ° ^ ° ^ ° ^ ° ^ ° ^°