Transcription of State of the property market in quarter 3 of 2017
1 Rode s report 2017:4 1 State of the property market State of the property market in quarter 3 of 2017 This issue of Rode s report found that the South African property market has slowed down further. In all the major office regions market rental rates grew slower than inflation, while only half of the major industrial regions managed to beat inflation. This is another way of saying new office and industrial developments are becoming less viable as the increase in building cost is generally faster than the increase in rental rates.
2 The good news is that flat rentals in most of the big cities, barring Cape Town, increased faster than inflation. Cape Town s house prices, however, beat inflation, but there is also a slowing trend as the affordability factor is coming into play more strongly. Against this weaker property sector backdrop, listed property prices are amazingly steady. The outlook for the property market has also deteriorated further due to the likelihood of a further slowdown in the country s economic growth, given the belated drastic fiscal measures announced by the Presidency in late November.
3 If implemented, these will inevitably reduce the take-home pay of taxpayers and reduce GDP growth. However, this weaker outlook is not yet reflected in this report , which focuses on the data of the third quarter of 2017. A summary of the main findings per property type follows. Quantitative overview of the property market Table 1 provides a snapshot of how the property market has performed over the past four quarters by comparing the latest information ( quarter 2017:3) with that collected a year ago.
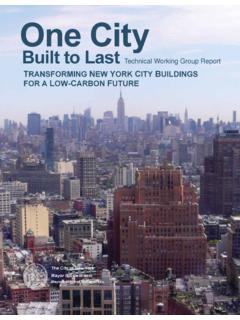
4 Office rentals The office market is like a becalmed sailing boat as there is little growth left in rentals as a result of weak demand-side conditions, not to mention a significant oversupply, with 10% of grade A and B office space vacant. In the third quarter of 2017 nominal market rentals in Johannesburg and Durban decentralized recorded yearly growth of 3%, while Pretoria decentralized grew by 2%. The weakest performance came from Cape Town decentralized, where rental rates remained roughly at previous-year levels.
5 In comparison, in the reporting quarter , building-cost inflation is expected to have shown yearly growth of about 5%. This implies that in all of the major office regions, office rentals declined in real terms. Tepid market -rental growth below building-cost inflation means new developments become progressively less viable. Rode s report 2017:4 2 State of the property market Table 1 The property market at a glance in quarter 2017:3* % growth on four quar ters ago (on smoothed data) NominalReal**A-grade decentralized office rentals Sandton CBD 4,2 -0,6 Randburg Ferndale 0,0 -4,6 Brooklyn / Waterkloof (Pta) 3,8 -0,9 Hatfield-6,2-10,6 Berea (Durban) 14,5 9,1 La Lucia / Umhlanga Ridge -2,0 -6,5 Claremont-1,3-5,9 Tyger Valley -5,0 -9,4 Century City 4,5 -0,4 Prime industrial rentals (500 m units)
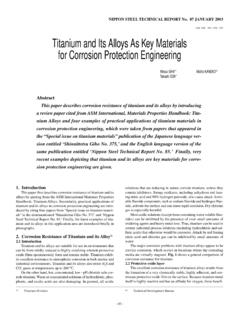
6 Central Witwatersrand 5,8 0,9 East Rand 4,8 0,0 Durban metro 3,2 -1,6 Cape Peninsula 10,8 5,7 Flat rentals (standard quality, all sizes) Johannesburg metro 6,6 1,6 Pretoria metro 6,5 1,4 Durban metro 7,9 2,8 Cape Town metro 1,1 -3,7 * Unless otherwise specified** Nominal values deflated by BER Building Cost Index; however, flat rentals are deflated using the CPII ndustrial market On the industrial property front, its rental drivers manufacturing and retail sales improved somewhat in the third quarter of 2017.
7 While the improvement is encouraging, the underlying pace remains slow. The outlook for market rentals is gloomy due to slow economic growth and the large increase in new developments planned. In the third quarter of 2017, nominal market rentals for prime industrial space in the Cape Peninsula and Central Witwatersrand recorded yearly growth of 11% and 6% respectively. This implies that these two regions managed to outgrow building-cost inflation, but the other major regions, Durban and East Rand, failed to do so.
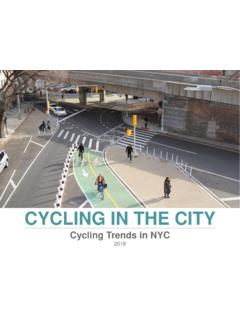
8 This means new developments in the last-mentioned two regions are becoming ever less viable. Flat rentals Flat rentals across South Africa grew by only 4,5% year-on-year in the third quarter of 2017 as households remain under financial pressure. The rental growth rate has decreased every quarter since growth peaked at about 10% at the start of 2016. During the quarter , rentals in Durban, Johannesburg and Pretoria all grew faster than consumer inflation of about 5%. In contrast, rental rates in Cape Town were unchanged from a year ago, implying that rentals fell by about 5% in real terms (that is, after adjusting for inflation).
9 The affordability factor comes strongly into play and can explain why Cape Town, where rental rates are the highest, has experienced a slowdown while the other major cities have shown sharp increases. Rode s report 2017:4 3 State of the property market The house market All metros, barring Cape Town, recorded modest house price changes below inflation in the third quarter of 2017. Cape Town s house prices grew by about 8%, but are slowing due to the affordability constraint. Strong headwinds, notably the dire financial situation of many households, should continue to hold back national demand for housing, thereby dampening price increases.
10