Transcription of STATEMENT OF COMPREHENSIVE INCOME - Colombo …
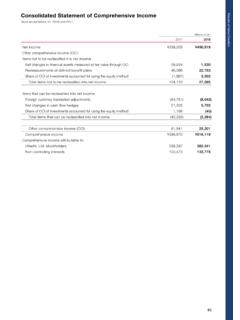
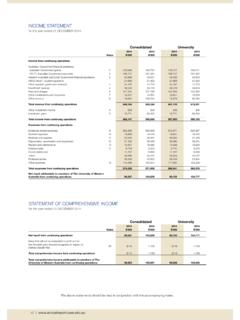
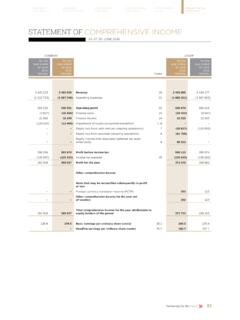
1 For the Period Ended 30 September2016201520162015Rs. 000sRs. 000sRs. 000sRs. 000sRevenue27,827,117 26,237,308 ,830,456 8,544,251 Cost of Sales (16,987,339) (16,268,325) (5,281,055) (5,183,211) Gross Profit10,839,778 9,968,983 ,549,401 3,361,040 Other Operating Expenses(3,759) (48) (8,593) (12,151) Marketing, Selling and Distribution Expenses(4,631,845) (3,877,493) (1,608,929) (1,467,821) Administrative Expenses (1,601,546) (1,533,839) (526,609) (504,562) Results from Operating Activities4,602,628 4,557,603 ,405,270 1,376,506 Financial Income26,440 26,115 ,032 10,104 Financial Expenses(32,559) (28,802) (13,441) (13,357)
2 Net Financing INCOME / (Expenses)(6,119) (2,687) (9,409) (3,253) Profit Before Taxation4,596,509 4,554,916 ,395,861 1,373,253 INCOME Tax Expenses(1,057,855) (1,071,139) (322,778) (347,109) Profit for the Period3,538,654 3,483,777 ,073,083 1,026,144 Other COMPREHENSIVE INCOME for the period- - - - Total COMPREHENSIVE Income3,538,654 3,483,777 1,073,083 1,026,144 Basic Earnings Per Share (EPS.) in brackets indicate figures are provisional and subject to HegdeJagdish Kumar SinglaManaging DirectorDirector Finance & Control08 November 2016 NESTL LANKA PLCSTATEMENT OF COMPREHENSIVE INCOMEYear to date % VarianceQuarter Performance1 AS AT 000sRs.
3 000sASSETSNon-Current AssetsProperty Plant and Equipment5,172,152 5,477,442 Capital Work-In-Progress503,307 143,597 5,675,459 5,621,039 Current AssetsInventories3,615,334 3,322,433 Trade and Other Receivables2,747,935 2,107,037 Amount Due from Related Parties202,431 203,975 Cash and Cash Equivalents79,485 867,563 6,645,185 6,501,008 Total Assets12,320,644 12,122,047 EQUITY AND LIABILITIESE quityStated Capital537,255 537,255 Retained Earnings4,057,743 3,984,381 4,594,998 4,521,636 Non-Current LiabilitiesRetirement Benefit Obligations430,079 522,240 Deferred Tax Liabilities747,586 699,452 1,177,665 1,221,692 Current LiabilitiesTrade and Other Payables3,884,315 4,137,446 Amount Due to Related Parties759,379 713,686 INCOME Tax Payable905,404 942,057 Dividends Payable134,411 137,220 Bank Overdrafts864,472 448,310 6,547,981 6,378,719 Total Liabilities7,725,646 7,600,411 Total Equity and Liabilities12,320,644 12,122,047 The figures are provisional and subject to auditAS AT (Rs.)
4 Asset value per value per share recorded during the quarter - Highest2, , - Lowest2, , - Last trade price (Date 30/09/2016 , 30/06/2016)2, , HegdeJagdish Kumar SinglaManaging DirectorDirector Finance & Control08 November 2016 NESTL LANKA PLCSTATEMENT OF FINANCIAL POSITION2 For the Period Ended 30 September20162015Rs. 000sRs. 000sCash Flow from Operating ActivitiesProfit before Taxation 4,596,5094,554,916 Adjustments for ;Depreciation468,844 450,412 Gain on sale of Property Plant and Equipment(20,480) (23,098) Amortization of Staff Loan Interest13,018 13,291 Interest Expense32,559 28,802 Interest INCOME (22,846) (18,856) Inventory Write Off80,039 94,810 Provision for Impairment of Trade Receivable24,844 12,441 Provision for Retirement Benefit Obligation79,042 74,168 Operating Profit before Working Capital Changes5,251,529 5,186,886 Working Capital ChangesIncrease in Inventories(372,567) (85,448)
5 Increase in Trade and Other Receivables(664,199) (522,407) Decrease in Trade and Other Payables(207,810) (395,163) Cash Generated from Operations4,006,953 4,183,868 Interest Paid(32,559) (28,802) INCOME Tax Paid(1,046,372) (750,465) Retirement Benefit Obligation Paid(171,204) (139,037) Net Cash Flows Generated from Operating Activities2,756,818 3,265,563 Cash Flow from Investing ActivitiesPurchase of Property, Plant and Equipment(544,105) (379,521) Proceeds from Sale of Property, Plant and Equipment41,321 26,845 Interest Received9,828 5,564 Net Cash Flows used in Investing Activities(492,956) (347,112) Cash Flow from Financing ActivitiesDividend Paid(3,468,102) (3,007,209) Net Cash Flows used in Financing Activities(3,468,102) (3,007,209) Net Decrease in Cash and Cash Equivalents(1,204,240) (88,758) Cash and Cash Equivalent at beginning of Year419,253 77,161 Cash and Cash Equivalent at End of Period(784,987) (11,597)
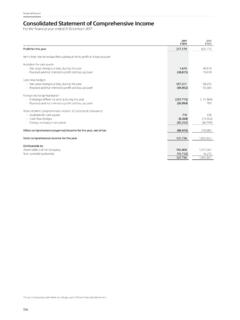
6 Analysis of Cash and Cash Equivalents at the End of the PeriodCash in Hand and Balances with Bank79,485 274,321 Bank Overdrafts (864,472) (285,918) (784,987) (11,597) NESTL LANKA PLCSTATEMENT OF CASH FLOWS 3 Stated CapitalRetained EarningsTotalRs. 000sRs. 000sRs. 000sBalance as at 01 January 2015537,255 3,550,673 4,087,928 Super Gain Tax - (638,365) (638,365) Adjusted Balance as at 01 January 2015537,255 2,912,308 3,449,563 Net profit for the 9 months ended 30 September 2015- 3,483,777 3,483,777 Second Interim Dividend for 2014- (1,531,176) (1,531,176) Final Dividend for 2014- (1,504,313) (1,504,313)
7 Balance as at 30 September 2015537,255 3,360,596 3,897,851 Net profit for the 3 months ended 31 December 2015- 640,547 640,547 Other COMPREHENSIVE Expenses- (16,762) (16,762) Balance as at 31 December 2015537,255 3,984,381 4,521,636 Balance as at 01 January 2016537,255 3,984,381 4,521,636 Net profit for the 9 months ended 30 September 2016- 3,538,654 3,538,654 Interim Dividend for 2015- (1,853,528) (1,853,528) Final Dividend for 2015- (1,611,764) (1,611,764) Balance as at 30 September 2016537,255 4,057,743 4,594,998 NESTL LANKA PLCSTATEMENT OF CHANGES IN EQUITY4 , other than the following;Events Occurring After the Reporting DateNOTES TO THE FINANCIAL STATEMENTSNESTL LANKA PLCN otes to the 30 September 2016 Quarterly StatementsTheAccountingpoliciesandmethod sofcomputationfollowedintheInterimAccoun tsisthesameasthatofthelatestyear end Financial Stated Capital consists of 53,725,463 Ordinary ,theCurrentIncomeTaxRateof28% , as the new rate is not substantially enacted as of the reporting ( )fromrevenuewhichwereearlierreportedaspa rtof Marketing,SellingandDistributionExpenses ( ).
8 Thisadjustmenthasnoimpactontheprofitorne tassetsofthecompany in both the reported InformationThere have been no material changes to the contingent liabilities since the last annual reporting NOTES TO THE FINANCIAL STATEMENTSNESTL LANKA PLCA dditional Notes and other information---NoNamesNo. of Shares%1 Nestl ,793,746 2 HSBC International Nominees Limited - State Street London C/O - SSBT - Fundsmith Emerging Equities Trust PLC386,576 3 HSBC International Nominees Limited - SSBT - Wasatch Frontier Emerging Small Countries Fund343,163 4 RBC Investor Services Bank - Coeli Sicav I-Frontier Markets Fund 238,500 5Ms. Neesha Harnam200,000 6 Northern Trust Company S/A Coupland Cardiff Funds PLC-CC Asian Evolution Fund195,961 7 HSBC International Nominees Limited - SSBT - Deutsche Bank AG Singapore A/C 01155,600 8 HSBC International Nominees Limited - SSBT - Frank Russel Trust Company Comingled Benefit Funds Trust GNA-6QH3128,076 9 HSBC International Nominees Limited - SSBT - Multipartner SICAV - WMP EM Established Leaders Fund114,000 10 Employees Provident Fund100,000 11 HSBC International Nominees Limited - JPMCB NA - Fidelity Asian Values PLC90,002 12CB NY S/A Wasatch Frontier Emerging Small Countries CIT Fund85,650 13 HSBC International Nominees Limited -UBS AG Singapore Branch (EX SBC)
9 85,000 14 Colombo Investment Trust PLC50,904 15 HSBC International Nominees Limited - BBH - Fidelity Funds48,180 16Mr. Bandaranayake Jayampathi Divale44,100 17Mr. Hirdaramani Anil Kumar Lalchand42,500 18 Mrs. Merchant Asha Ajay41,000 19 Mrs. Singh Jasbinderjit Kaur Piara40,100 20Mr. Maheswaran Radhakrishnan36,671 Names and the number of shares held by the 20 major shareholders, and the percentages of such ,whoholds1000shares as at period capitalization of the Public Holding : ,848,070 (Rs 000)Public Holding Percentage: Number of Public shareholders - 5.