Example: bankruptcy
STATISTICAL TABLES
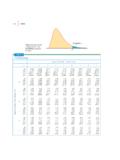
STATISTICAL TABLES 2 TABLE A.2 t Distribution: Critical Values of t Significance level Degrees of Two-tailed test: 10% 5% 2% 1% 0.2% 0.1% freedom One-tailed test: 5% 2.5% 1% 0.5% 0.1% 0.05% 1 6.314 12.706 31.821 63.657 318.309 636.619 2 2.920 4.303 6.965 9.925 22.327 31.599 3 2.353 3.182 4.541 5.841 10.215 12.924 4 2.132 2.776 3.747 4.604 7.173 8.610 5 2.015 2.571 …
Tags:
Information
Domain:
Source:
Link to this page:
Documents from same domain
Ethical issues across cultures: managing the …
home.ubalt.eduEthical issues across cultures: managing the differing perspectives of China and the USA Dennis A. Pitta Professor of Marketing, University of Baltimore, Baltimore,

New Lectures5&6&7 PM Scheduling IP ENCE603 …
home.ubalt.edu12 Copyright 2008, Dr. Steven A. Gabriel 23 • The early event time for node i, ET(i), is the earliest time at which the event corresponding to node i can occur • The late event time for node i, LT(i), is the latest time at which the event
cognitive ability testing - ubalt.edu
home.ubalt.eduCognitive Ability Testing What do Cognitive Ability Tests Measure? Cognitive ability tests are designed to ... and the Bennett Mechanical Comprehension Test.

Chapter 9 Basic Oligopoly Models - ubalt.edu
home.ubalt.edu9-12 Sweezy Oligopoly Summary Firms believe rivals match price cuts, but not price increases. Firms operating in a Sweezy oligopoly maximize profit by producing where
Competency Modeling & Job Analysis - ubalt.edu
home.ubalt.eduCompetency Modeling & Job Analysis 3 analysis of 39 studies, which used a pre- and post-test design to examine the impact of CTA on performance (Lee, 2004).

Chapter 11 Pricing Strategies for Firms with Market …
home.ubalt.edu11-4 An Algebraic Example P = 10 - 2Q C(Q) = 2Q If the firm must charge a single price to all consumers, the profit-maximizing price is obtained by setting MR = MC.
Journal of Applied Psychology - ubalt.edu
home.ubalt.eduJournal of Applied Psychology The Good and Bad of Being Fair: Effects of Procedural and Interpersonal Justice Behaviors on Regulatory Resources Russell E. Johnson, Klodiana Lanaj, and Christopher M. Barnes
Relationship of Personality to Performance Motivation: A ...
home.ubalt.eduFor the remaining 327 journal articles and 217 doctoral dissertations, we examined each study to determine whether it contained a measure of personality, a criterion measure, and the data necessary to compute a
Successful strategic alliances with international partners ...
home.ubalt.eduSuccessful strategic alliances with international partners 233 Biographical notes: Van R. Wood (PhD) is a Professor of International Marketing and the Philip Morris Endowed Chair in International Business
If We Are So Rich, Why Aren't We Happy? - UBalt
home.ubalt.eduing, and you shall live as a god among men. (Epicurus of Samos, trans. 1998, p. 48) This is not the image of epicureanism held by most people. The popular view holds that pleasure and material comforts should be grasped wherever they can, and that these alone will improve the quality of one's life. As the
Related documents
Integre Technical Publishing Co., Inc. Moore/McCabe ...
www.stat.purdue.eduT-12 • Tables Table entry for p is the critical value F∗ with probability p lying to its right. F* Probability p TABLE E F critical values Degrees of freedom in the numerator p 123456789.100 39.86 49.50 53.59 55.83 57.24 58.20 58.91 59.44 59.86

Critical Values of the Spearman’s Ranked Correlation ...
webspace.ship.eduCritical Values of the Spearman’s Ranked Correlation Coefficient (r )s Taken from Zar, 1984 Table B.19. 20 rte rts 58 se sr so 18 n re n rs rr a o' o. 0 0 ' roo O ror 'ros o o o roe o o rro .rrr o rn o rre .rr8 o rso rsr 0. rStt .rse 0 no 0 ne o rtts ree rer rea o

Tables of Normal Values (As of January 2013)
www.ccpe-cfpc.orgTables of Normal Values (As of January 2013) Note: Values and units of measurement listed in these tables are derived from several resources. Substantial variation exists in the ranges quoted as “normal” and may vary depending on the assay used by different laboratories. Therefore, these tables should be considered as directional only.

Word 2016, Creating a Table - Montclair State University
www.montclair.edu3 When working within a table, the Table Tools tab appears in the Ribbon, and includes the Design and Layout tabs. To Insert a Row: 1) Position the cursor in the table where you would like to insert a row 2) Select the Layout tab under Table Tools 3) Click either the Insert Above or Insert Below row buttons in the Rows & Columns group To Insert a Column:

Table of Exact Trig Values - Livingston Public Schools
www.livingston.orgTable of Trigonometric Functions – Exact Values for Special Angles Angle θ Values of the trigonometric functions in degrees in radians sin(θ) cos(θ) tan(θ) cot(θ) sec(θ) csc(θ)

Table of critical values for the F distribution (for use ...
homepages.wmich.eduThe second table gives critical values of F at the p = 0.01 level of significance. 1. Obtain your F-ratio. This has (x,y) degrees of freedom associated with it. 2. Go along x columns, and down y rows. The point of intersection is your critical F-ratio. 3. If your obtained value of F is equal to or larger than this critical F-value, then your ...

TABLE A-3 tDistribution: Critical tValues
www.math.odu.eduCritical t value (negative) a Left tail Critical t value (positive) a Right tail Critical t value (positive) Critical t value (negative) a/2 a/2 Two tails TABLE A-3 tDistribution: Critical tValues Area in One Tail 0.005 0.01 0.025 0.05 0.10
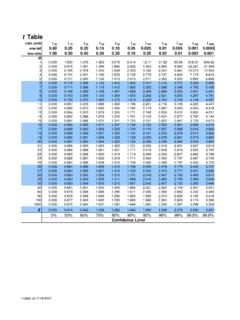
t Table - San Jose State University
www.sjsu.eduJul 14, 2007 · t-table.xls 7/14/2007. Title: t-table.xls Created Date: 7/14/2007 1:36:27 PM ...

Standard Thermodynamic Values
www.drjez.com31 Standard Thermodynamic Values Formula State of Matter Enthalpy (kJ/mol) Entropy (J mol/K) Gibbs Free Energy (kJ/mol) (NH 4) 2O (l) -430.70096 267.52496 -267.10656 (NH 4) 2SiF 6 (s hexagonal) -2681.69296 280.24432 -2365.54992 (NH 4) 2SO 4 (s) -1180.85032 220.0784 -901.90304 Ag (s) 0 42.55128 0