Transcription of Statistics 502 Lecture Notes
1 Statistics 502 Lecture Notes Peter D. Hoff c December 9, 2009. Contents 1 principles of experimental design 1. Induction .. 1. Model of a process or system .. 2. Experiments and observational studies .. 2. Steps in designing an experiment .. 6. 2 Test Statistics and randomization distributions 9. Summaries of sample populations .. 10. Hypothesis testing via randomization .. 13. Essential nature of a hypothesis test .. 17. Sensitivity to the alternative hypothesis .. 18. Basic decision theory .. 23. 3 Tests based on population models 25. Relating samples to populations .. 25. The normal distribution .. 29. Introduction to the t-test.
2 30. Two sample tests .. 36. Checking assumptions .. 42. Checking normality .. 43. Unequal variances .. 43. 4 Confidence intervals and power 47. Confidence intervals via hypothesis tests .. 47. Power and Sample Size Determination .. 49. The non-central t-distribution .. 52. Computing the Power of a test .. 54. i CONTENTS ii 5 Introduction to ANOVA 60. A model for treatment variation .. 62. Model Fitting .. 63. Testing hypothesis with MSE and MST .. 66. Partitioning sums of squares .. 70. The ANOVA table .. 72. Understanding Degrees of Freedom: .. 73. More sums of squares geometry .. 76. Unbalanced Designs .. 78. Sums of squares and degrees of freedom.
3 79. ANOVA table for unbalanced data: .. 81. Normal sampling theory for ANOVA .. 83. Sampling distribution of the F -statistic .. 85. Comparing group means .. 88. Power calculations for the F-test .. 90. Model diagnostics .. 92. Detecting violations with residuals .. 93. Checking normality assumptions: .. 94. Checking variance assumptions .. 96. Variance stabilizing transformations .. 100. Treatment Comparisons .. 106. Contrasts .. 107. Orthogonal Contrasts .. 110. Multiple Comparisons .. 112. False Discovery Rate procedures .. 115. Nonparametric tests .. 115. 6 Factorial Designs 116. Data analysis: .. 117. Additive effects model.
4 123. Evaluating additivity: .. 126. Inference for additive treatment effects .. 130. Randomized complete block designs .. 140. Unbalanced designs .. 146. Non-orthogonal sums of squares: .. 153. Analysis of covariance .. 155. Types of sums of squares .. 159. CONTENTS iii 7 Nested Designs 163. Mixed-effects approach .. 171. Repeated measures analysis .. 174. List of Figures Model of a variable process .. 2. Wheat yield distributions .. 12. Approximate randomization distribution for the wheat example 16. Histograms and empirical CDFs of the first two hypothetical samples.. 20. Randomization distributions for the t and KS Statistics for the first example.
5 21. Histograms and empirical CDFs of the second two hypotheti- cal samples.. 22. Randomization distributions for the t and KS Statistics for the second example.. 22. The population model .. 27. 2 distributions .. 33. t-distributions .. 34. The t-distribution under H0 for the wheat example .. 39. Randomization and t-distributions for the t-statistic under H0 40. Normal scores plots.. 44. A t10 distribution and two non-central t10 -distributions.. 52. Critical regions and the non-central t-distribution .. 55. and power versus sample size, and the normal approximation to the power.. 57. Null and alternative distributions for another wheat example, and power versus sample size.
6 59. Response time data .. 61. Randomization distribution of the F -statistic .. 70. iv LIST OF FIGURES v Coagulation data .. 83. F-distributions .. 87. Normal-theory and randomization distributions of the F -statistic 88. Power as a function of n for m = 4, = and 2 / 2 = 1 . 92. Power as a function of n for m = 4, = and 2 / 2 = 2 . 92. Normal scores plots of normal samples, with n {20, 50, 100} 95. Crab data .. 97. Crab residuals .. 98. Fitted values versus residuals .. 99. Data and log data .. 101. Diagnostics after the log transformation .. 102. Mean-variance relationship of the transformed data .. 107. Yield-density data .. 110.
7 Marginal Plots.. 118. Conditional Plots.. 119. Cell plots.. 120. Mean-variance relationship.. 120. Mean-variance relationship for transformed data.. 121. Plots of transformed poison data .. 122. Comparison between types I and II, without respect to deliv- ery.. 131. Comparison between types I and II, with delivery in color.. 132. Marginal plots of the data.. 136. Three datasets exhibiting non-additive effects.. 139. Experimental material in need of blocking.. 141. Results of the experiment .. 142. Marginal plots, and residuals without controlling for row.. 143. Marginal plots for pain data .. 150. Interaction plots for pain data.
8 151. Oxygen uptake data .. 156. ANOVA and ANCOVA fits to the oxygen uptake data .. 157. Unbalanced design: Controlling eliminates effect.. 159. Unbalanced design: Controlling highlights effect.. 161. Potato data.. 165. Diagnostic plots for potato ANOVA.. 166. Potato data .. 167. LIST OF FIGURES vi Potato data .. 172. Sitka spruce data.. 174. ANCOVA fit and residuals .. 176. Within-tree dependence .. 177. Reduction to tree-specific summary Statistics .. 178. Chapter 1. principles of experimental design Induction Much of our scientific knowledge about processes and systems is based on induction: reasoning from the specific to the general.
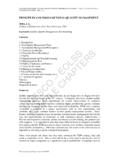
9 Example (survey): Do you favor increasing the gas tax for public trans- portation? Specific cases: 200 people called for a telephone survey Inferential goal: get information on the opinion of the entire city. Example (Women's Health Initiative): Does hormone replacement im- prove health status in post-menopausal women? Specific cases: Health status monitored in 16,608 women over a 5-year period. Some took hormones, others did not. Inferential goal : Determine if hormones improve the health of women not in the study. 1. CHAPTER 1. principles OF EXPERIMENTAL DESIGN 2. x1. x2 Process y . Figure : Model of a variable process Model of a process or system We are interested in how the inputs of a process affect an output.
10 Input variables consist of controllable factors x1 : measured and determined by scientist. uncontrollable factors x2 : measured but not determined by scientist. noise factors : unmeasured, uncontrolled factors, often called experimen- tal variability or error . For any interesting process, there are inputs such that: variability in input variability in output If variability in an input factor x leads to variability in output y, we say x is a source of variation. In this class we will discuss methods of designing and analyzing experiments to determine important sources of variation. Experiments and observational studies Information on how inputs affect output can be gained from: Observational studies: Input and output variables are observed from a pre-existing population.