Transcription of Strategic Income Opportunities Fund
1 BSIIXS trategic Income Opportunities FundAs of 09/30/2021 | Class K: BSIKX | Institutional: BSIIX | Investor A: BASIX | Investor C: BSICXF lexible, core bond complementDiversified across markets and strategiesSeeks total return that is consistent with preservation of capitalMorningstar has awarded the fund a Gold medal (Effective 02/18/2021). Rated against 310 Nontraditional Bond Funds, as of 09/30/2021 based on risk adjusted total return. Overall Ratings are determined monthly and subject to change. The Overall Morningstar Rating for a fund is derived from a weighted average of the performance figures associated with its 3-, 5- and 10-year (if applicable) Morningstar Rating metrics.
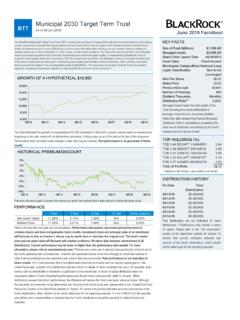
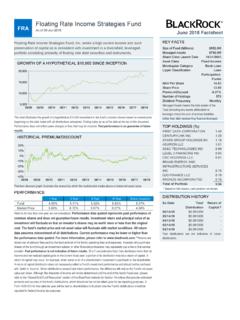
2 ANNUALIZED PERFORMANCEW ithout Sales Charge1 Year3 Year5 Year10 YEAR PERFORMANCEW ithout Sales data shown represents past performance which is no guarantee of future results. Investment returns andprincipal values may fluctuate so that an investor's shares, when redeemed, may be worth more or less than theiroriginal cost. Current performance may be lower or higher than that shown. All returns assume reinvestment of alldividend and capital gain distributions. Refer to for current month-end performance. Index performanceis shown for illustrative purposes only. It is not possible to invest directly in an unmanaged index. Institutional shareshave limited availability and may be purchased at various minimums.
3 Please see the fund prospectus for more RANKINGS1 Year3 Year5 Year10 YearMorningstar Ranking144/35158/31064/28219/118 Quartile Rank2111 Rankings based on total return excluding sales charges, independently calculated and not combined to create an overallranking. For periods not shown, Morningstar does not provide rankings based on synthetic Risks: The fund is actively managed and its characteristics will vary. Bond values fluctuate in price so the value ofyour investment can go down depending on market conditions. International investing involves special risks including, butnot limited to currency fluctuations, illiquidity and volatility.
4 These risks may be heightened for investments in emergingmarkets. Fixed Income risks include interest-rate and credit risk. Typically, when interest rates rise, there is acorresponding decline in bond values. Credit risk refers to the possibility that the bond issuer will not be able to makeprincipal and interest payments. Principal of mortgage- or asset-backed securities normally may be prepaid at any time,reducing the yield and market value of those securities. Obligations of US govt. agencies are supported by varyingdegrees of credit but generally are not backed by the full faith and credit of the US govt. Non-investment-grade debtsecurities (high-yield/junk bonds) may be subject to greater market fluctuations, risk of default or loss of Income andprincipal than higher rated securities.
5 The fund may use derivatives to hedge its investments or to seek to enhancereturns. Derivatives entail risks relating to liquidity, leverage and credit that may reduce returns and increase entails special risks. If the fund makes short sales in securities that increase in value, the fund will losevalue. Any loss on short positions may or may not be offset by investing short-sale proceeds in other fund s information prior to September 17, 2018 is the information of a predecessor fund . The predecessor fund hadthe same investment objectives, strategies and policies, portfolio management team and contractual arrangements,including the same contractual fees and expenses, as the fund as of the date of the reorganization.
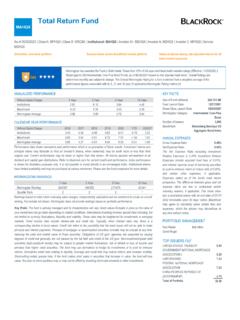
6 As a result of thereorganization, the fund adopted the performance and financial history of the predecessor FACTSSize of fund (Millions)$44, Launch Date02/05/2008 Share Class Launch Date02/05/2008 Morningstar CategoryNontraditional BondNumber of Issuers4,717 BenchmarkBBG Barc Universal IndexANNUAL EXPENSESG ross Expense Expense Net Expense Ratio excluding InvestmentRelated Expenses is Investment RelatedExpenses include acquired fund fees of ,and interest expense (cost of borrowing securitiesto seek to enhance return or reduce risk) of ,and certain other expenses, if stated as of the fund 's most recentprospectus.
7 The difference between gross and netexpense ratios are due to contractual and/orvoluntary waivers, if applicable. This share classhas a contractual waiver with an end date of 06/30/2023 terminable upon 90 days notice. BlackRockmay agree to voluntarily waive certain fees andexpenses, which the adviser may discontinue atany time without MANAGEMENTRick RiederBob MillerDavid RogalTOP ISSUERS (%)2 UNITED STATES NATIONAL MORTGAGE ASSOCIATION PEOPLES REPUBLIC OF (GOVERNMENT) REPUBLIC OF (GOVERNMENT) of % of net assets represents the fund 's exposure based on the economic value of securities and is adjusted for futures, options, swaps, and convertible bonds.
8 Allocations subject tochange. 3 The fund itself has not been rated by an independent rating agency. Credit quality ratings on underlying securities of the fund are received from S&P, Moody s and Fitch and convertedto the equivalent S&P major rating category. This breakdown is provided by BlackRock and takes the median rating of the three agencies when all three agencies rate a security thelower of the two ratings if only two agencies rate a security and one rating if that is all that is provided. Unrated securities do not necessarily indicate low quality. Below investment-gradeis represented by a rating of BB and below. Ratings and portfolio credit quality may change over Duration: Measures the sensitivity of the price of a bond with embedded options to changes in interest rates, taking into account the likelihood of the bond being called, putand/or sunk prior to its final maturity date.
9 BlackRock uses a proprietary duration model which employs certain assumptions and may differ from other fund complexes. Effective Durationis measured at the portfolio level and adjusted for leverage, hedging transactions and non-bond holdings, including derivatives. Standard Deviation: Standard Deviation measures thevolatility of the funds returns. Higher deviation represents higher volatility. Sharpe Ratio: Sharpe Ratio uses a funds standard deviation and its excess return (difference between thefunds return and the risk-free return of 90-day Treasury Bills) to determine reward per unit of risk. 30-day SEC Yield: A standard calculation of yield introduced by the SEC to providefairer comparison among funds.
10 This yield reflects the interest earned after deducting the fund 's expenses during the most recent 30-day period by the average investor in the fund . Unsubsidized SEC Yield: Represents what a fund 's 30-Day SEC Yield would have been had no fee waivers or expense reimbursement been in place over the period. Negative 30-DaySEC Yield results when accrued expenses of the past 30 days exceed the Income collected during the past 30 days. Weighted Average Life: The average number of years for whicheach dollar of unpaid principal on a loan or mortgage remains outstanding. Once calculated, WAL tells how many years it will take to pay half of the outstanding should consider the investment objectives, risks, charges and expenses of the fund carefully before investing.