Transcription of Students With Disabilities
1 The Condition of Education 2021 | 1 Chapter: 2/Preprimary, Elementary, and Secondary Education Section: Elementary and Secondary EnrollmentStudents With DisabilitiesIn 2019 20, the number of Students ages 3 21 who received special education services under the Individuals with Disabilities Education Act (IDEA) was million, or 14 percent of all public school Students . Among Students receiving special education services, the most common category of disability (33 percent) was specific learning in 1975, the Individuals with Disabilities Education Act (IDEA), formerly known as the Education for All Handicapped Children Act, mandates the provision of a free and appropriate public school education for eligible Students ages 3 21.
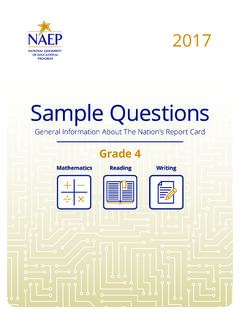
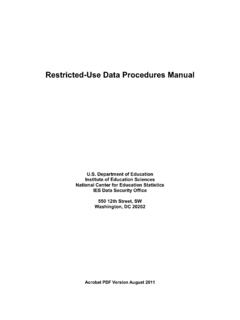
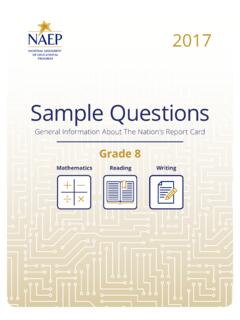
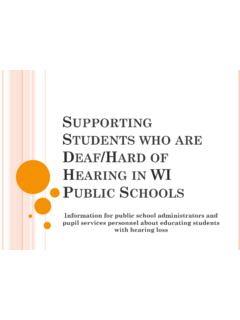
2 Eligible Students are those identified by a team of professionals as having a disability that adversely affects academic performance and as being in need of special education and related services. Data collection activities to monitor compliance with IDEA began in 1976. From school year 2009 10 through 2019 20, the number of Students ages 3 21 who received special education services under IDEA increased from million, or 13 percent of total public school enrollment, to million, or 14 percent of total public school Figure 1. Percentage distribution of Students ages 3 21 served under the Individuals with Disabilities Education Act (IDEA), by disability type.
3 School year 2019 20 Orthopedic impairmentHearing impairmentMultiple disabilitiesEmotional disturbanceIntellectual disabilityDevelopmental delayAutismOther health impairment1 Speech or language impairmentSpecific learning disability11256711151933 Percent01020304050 Disability type1 Other health impairments include having limited strength, vitality, or alertness due to chronic or acute health problems such as a heart condition, tuberculosis, rheumatic fever, nephritis, asthma, sickle cell anemia, hemophilia, epilepsy, lead poisoning, leukemia, or : Data are for the 50 states and the District of Columbia only. visual impairment , traumatic brain injury, and deaf-blindness are not shown because they each account for less than percent of Students served under IDEA.
4 Due to categories not shown, detail does not sum to 100 percent. Although rounded numbers are displayed, the figures are based on unrounded : Department of Education, Office of Special Education Programs, Individuals with Disabilities Education Act (IDEA) database, retrieved February 2, 2021, from #bcc. See Digest of Education Statistics 2020, table Condition of Education 2021 | 2 Chapter: 2/Preprimary, Elementary, and Secondary Education Section: Elementary and Secondary EnrollmentStudents With DisabilitiesAmong Students who received special education services under IDEA in school year 2019 20, the category of Disabilities with the largest reported percentage of Students was specific learning Disabilities .
5 A specific learning disability is a disorder in one or more of the basic psychological processes involved in understanding or using spoken or written language that may manifest itself in an imperfect ability to listen, think, speak, read, write, spell, or do mathematical calculations. Thirty-three percent of all Students who received special education services had specific learning Disabilities , 19 percent had speech or language impairments,2 and 15 percent had other health impairments (including having limited strength, vitality, or alertness due to chronic or acute health problems such as a heart condition, tuberculosis, rheumatic fever, nephritis, asthma, sickle cell anemia, hemophilia, epilepsy, lead poisoning, leukemia, or diabetes).
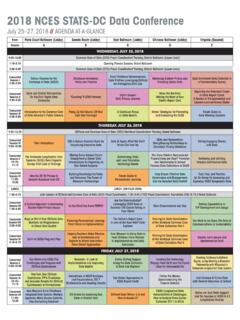
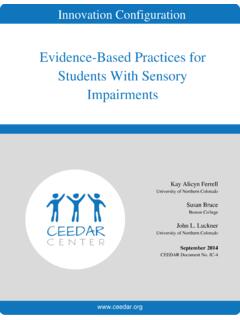
6 Students with autism, developmental delays, intellectual Disabilities , and emotional disturbances each accounted for between 5 and 11 percent of Students served under IDEA. Students with multiple Disabilities , hearing impairments, orthopedic impairments, visual impairments, traumatic brain injuries, and deaf-blindness each accounted for 2 percent or less of those served under Condition of Education 2021 | 3 Chapter: 2/Preprimary, Elementary, and Secondary Education Section: Elementary and Secondary EnrollmentStudents With DisabilitiesFigure 2. Percentage of Students ages 3 21 served under the Individuals with Disabilities Education Act (IDEA), by race/ethnicity: School year 2019 20To talWhiteBlackHispanicAsianRace/ethnicity PacificIslanderAmerican Indian/Alaska NativeTwo ormore races 01020304050 Percent141517147111815 NOTE: Based on the projected total public school enrollment in prekindergarten through grade 12 by race/ethnicity.
7 Although data are for the 50 states and the District of Columbia, data limitations result in inclusion of a small (but unknown) number of Students from other jurisdictions. Race categories exclude persons of Hispanic ethnicity. Although rounded numbers are displayed, the figures are based on unrounded : Department of Education, Office of Special Education Programs, Individuals with Disabilities Education Act (IDEA) database, retrieved February 4, 2021, from #bcc; and National Center for Education Statistics, National Elementary and Secondary Enrollment Projection Model, 1972 through 2029. See Digest of Education Statistics 2020, table school year 2019 20, the percentage of Students served under IDEA was highest for American Indian/Alaska Native Students (18 percent), followed by Black Students (17 percent), and Students of Two or more races (15 percent), which were all at least one percentage point higher than the percentage of public school Students served under IDEA overall (14 percent).
8 The percentage was lowest for Pacific Islander Students (11 percent) and Asian Students (7 percent). The percentage distribution of Students receiving special education services for various types of Disabilities differed by race/ethnicity in school year 2019 20. For most racial/ethnic groups, specific learning Disabilities and speech or language impairments were the two most common types of Disabilities , accounting for at least 43 percent of Students receiving IDEA services. Among Hispanic, American Indian/Alaska Native, and Pacific Islander Students ages 3 21, specific learning Disabilities and speech or language impairments together accounted for 50 percent or more of those who received special education services in school year 2019 20.
9 For Asian Students , in contrast, although these two Disabilities accounted for 43 percent of Students receiving IDEA services, the most common disability for Asian Students was autism (25 percent). The percentage of Students from other racial/ethnic backgrounds receiving IDEA services due to autism ranged from 7 to 12 percent. After Asian Students , the groups for whom specific learning Disabilities and speech or language impairments made up the smallest percentage of Students receiving IDEA services were Black Students and Students of Two or more races (49 percent each). Among Students served under IDEA, a higher percentage of Students from these two groups were reported as having emotional disturbances (7 percent each) and other health impairments (16 percent each) than for Students overall (5 percent and 15 percent, respectively).
10 3 Separate data on special education services for males and females are available only for Students ages 6 21,4 rather than ages 3 21. Among those 6- to 21-year-old Students enrolled in public schools in school year 2019 20, a higher percentage of male Students (18 percent) than of female Students (10 percent) received special education services under IDEA. In addition, the percentage distribution of 6- to 21-year-old Students who received various types of special education services in 2019 20 differed by sex. For example, the percentage of Students served under IDEA who received services for specific learning Disabilities was higher for female Students (44 percent) than for male Students (33 percent), while the percentage who received services for autism was higher for male Students (14 percent) than for female Students (5 percent).