Transcription of SUGI 23: A Method to Generate Kaplan-Meier and …
1 A Method to Generate Kaplan-Meier and adjusted survival curves using SASB harat Thakkar, Kwan Hur, William G. Henderson, and Charles Oprian Department of Veteran affairs cooperative Studies Program Hines, ILAbstract Kaplan-Meier (K-M) survival curves can begenerated using SAS PROC LIFETEST. In thepresence of significant covariates, adjusting thesurvival curves is necessary. In this paper a step bystep Method is presented to produce survival curvesthat adjusted for the covariates. This is accomplishedusing SAS PROC PHREG and SAS PROC In clinical research often a comparison ofsurvival curves is made between treatment SAS PROC LIFETEST produces K-M survivalcurves that depend only on time. However, thesurvival curves may depend on both time andcovariates. Here, adjusting the survival curves forthese covariates is problem faced is to devise a Method ofgenerating survival curves adjusted for thecovariates.
2 To obtain the adjusted survival curves ,one must adjust for the covariates that werestatistically significant in the regression model. Thisregression model then estimates the survivalfunction. This paper presents a Method to Generate survivalcurves adjusted for the covariates from a Coxproportional hazard model. An example taken fromthe VA Cooperative Study #90, Prognosis andOutcome Following Heart Valve Replacement ,consisting of a total of 938 aortic patients (299medical patients and 639 surgical patients) was usedto illustrate this Building Significant predictors of survival can be identifiedusing Cox regression model if the proportionalhazard assumption is valid. A stepwise procedure canbe used to select the significant covariates. Forexample, the following SAS code produces astepwise model including the entry or removal of thecovariates at each step.
3 Other selection methods such as forward selectionor backward elimination may beproc phreg=clean; model times*censor(0)= treat var_1- var_p /selection = stepwise details;run; used to identify significant covariates. The variablesthat are statistically significant in the final step of theselection procedure are the significant covariates inthe Function Estimation After determining the covariates in the final modelPROC PHREG is run with the BASELINE BASELINE statement in PROC PHREG createsa new data set which contains the survival functionestimates at the event times of each stratum for eachlist of covariates in the COVARIATE = data set. Bydefault the data set contains the survival functionestimates corresponding to the means of thecovariates for each may be interested in computing thesurvival function estimates for a set of covariateswith specific values other than the means.
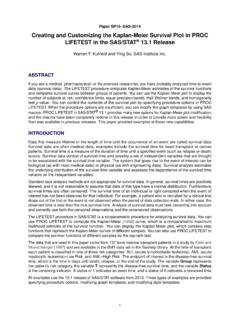
4 Here, theCOX regression model can be rerun with theCOVARIATES= data set in the BASELINE statement. This data set contains specific values inthe model. For example, the following SAS code willgenerate the survival function estimates for the set ofgiven phreg data = clean;model times*censor(0)=treat var_1 - var_p;baseline covariates = cov out = resultsurvival =s nomean;run;ExampleA subset of 938 aortic patients taken fromthe VA Study #90 was used for the analysis. Therewere 299 medical patients and 639 surgical patientsfollowed for 20 years. The observed survival rate forthe medical group was % (86 Statistics, Data Analysis, and ModelingStatistics, Data Analysis, and Modelingpatients),compared to % (178 patients) for thesurgical group. The medicalgroup had a mean survival time of years with astandard deviation of , while the surgical grouphad a mean survival time of years with astandard deviation of K-M survival curves were calculatedusing PROC LIFETEST and are displayed in 1.
5 K-M survival curves The surgical subgroup had longer survival times thanthe medical Cox regression model for this dataincluded the following covariates: treatment group,age, functional class, hypertension, smoking,hemoglobin, and number ofoccluded arteries. using the means of thesecovariates in the Cox regression model the estimatedsurvival functions were calculated for each data set that contains the estimatedsurvival functions can be read by PROC 2 displays the adjusted survival curves foreach 2. adjusted survival CurvesAfter adjusting for the significant covariatesthe survivals times for the surgical subgroup werelonger than the medical subgroup. The difference inthe survival probabilities between the two subgroupsafter 12 years is more pronounced in the adjustedsurvival curves than the K-M survival the Method described above it ispossible to create K-M survival curves and survivalcurves adjusted for the covariates in a regressionmodel.
6 A comparison between the K-M and adjustedsurvival curves as illustrated in the above exampleshows the importance of adjusting for the survival curves can be constructedfor different sets of covariates. In this manner thesurvival functions corresponding to differentcovariates may be SAS Institute Inc. (1990), The LifeTest Procedure , Chapter 26 of SAS/STAT User sGuide Version 6, Fourth Edition, Volume 2,Cary, NC SAS Institute Inc. 2 Marubini, Ettore and Valsecchi, Maria Grazia Analyzing survival Data from Clinical Trials and Observaional Studies New York, NY John Wiley & Sons, 19953. SAS Institute Inc. (1992), The PHREG Procedure , Chapter 19 of SAS Technical Report P-229 , Cary, NC SAS Institute Inc. 4. Collett,D Modelling survival Data in Medical Research London, England Chapman & Hall, 1994 SurgicalStatistics, Data Analysis, and ModelingStatistics, Data Analysis, and Modeling Author Contact Department of Veteran Affairs Edward Hines Jr.
7 VA Hospital Bharat Thakkar 151A 5th and Roosevelt road Hines IL. 60141 (708)343-7200 x3555 e-mail: Data Analysis, and ModelingStatistics, Data Analysis, and Modeling