Transcription of Summary Charts - California Budget
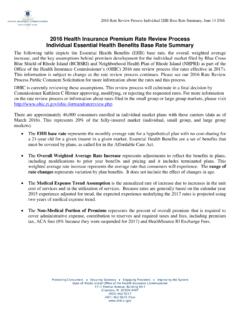
1 Summary Charts13G B S 2016 -17uEYnqQoZ1215 This section provides various statewide Budget Charts and ChartsGovernor s Budget Summary 2016 -17 Summary Charts14uEYnqQoZ12152015-162016-17 Prior Year Balance$3,699$5,172 Revenues and Transfers$117,537$120,633 Total Resources Available$121,236$125,805 Non-Proposition 98 Expenditures$66,072$71,637 Proposition 98 Expenditures$49,992$50,972 Total Expenditures$116,064$122,609 Fund Balance$5,172$3,196 Reserve for Liquidation of Encumbrances$966$966 Special Fund for Economic Uncertainties$4,206$2,230 Budget Stabilization Account/Rainy Day Fund$4,455$8, SUM-012016-17 Governor's BudgetGeneral Fund Budget Summary (Dollars in Millions) Summary Charts15G B S 2016 -17uEYnqQoZ12152015-162016-17 Dollar ChangePercentChangeLegislative, Judicial, Executive$3,227$3,330$ , Consumer Services & Resources2,7302, and Human Services31,66633,7422, and Rehabilitation10,27610, Education49,85951,2301, Education14,31214, and Workforce Operations7612,2451, Government:Non-Agency Relief/Local Expenditures6371,9631, $116,064$122,609$6.
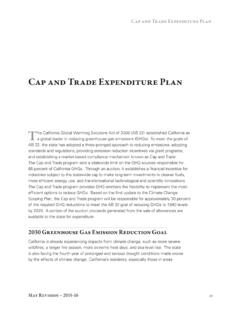
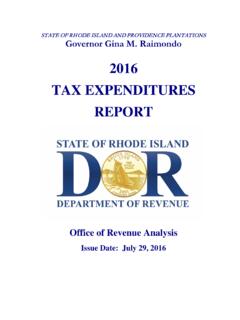
2 Numbers may not add due to rounding. Figure SUM-02 General Fund Expenditures by Agency(Dollars in Millions)Change from 2015-16 Natural Resources ($2,909) Health ($25,227) Human Services ($8,515) Corrections and Rehabilitation ($10,620) K- 12 Education ($51,230) Higher Education ($14,567) Other ($9,541) Figure SUM-03 2016 -17 General Fund Expenditures (Dollars in Millions) Governor s Budget Summary 2016 -17 Summary Charts16uEYnqQoZ12152015-162016-17 Dollar ChangePercentChangePersonal Income Tax$81,354$83,841$2, and Use Tax25,24625, Tax10,30410, Tax2,4932, Beverage Taxes and Vehicle $120,386$124,189$3, to the Budget Stabilization Account/Rainy Day Fund-2,849-3, $117,537$120,633$3.
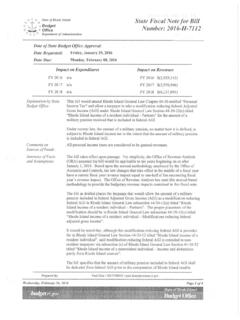
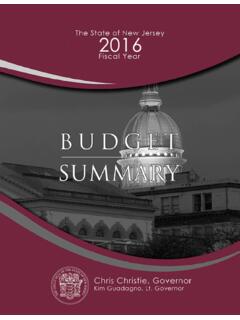
3 Numbers may not add due to SUM-04 General Fund Revenue Sources(Dollars in Millions)Change from 2015-16 Corporation Tax ($10,956) Insurance Tax ($2,549) Personal Income Tax ($83,841) Sales and Use Tax ($25,942) Other ($901) Figure SUM-05 2016 -17 General Fund Revenues and Transfers1/ (Dollars in Millions) 1/ Excludes $3,556 million transfer to Rainy Day Fund. Summary Charts17G B S 2016 -17uEYnqQoZ1215 General FundSpecial FundsBondFundsTotalsLegislative, Judicial, Executive $3,330$3,967$561$7,858 Business, Consumer Services & Housing4348451381,417 Transportation2229,9211,48311,626 Natural Resources 2,9091,6265045,039 Environmental Protection -313,339343,342 Health and Human Services 33,74218,799-52,541 Corrections and Rehabilitation 10,6202,686-13,306K-12 Education 51,2308912251,441 Higher Education 14,5679923614,902 Labor and Workforce Development 166729-895 Government Operations2,245-1,23261.
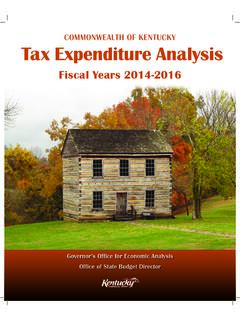
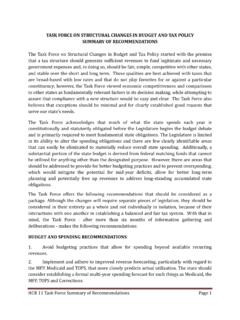
4 019 General GovernmentNon-Agency Departments7292,04622,777 Tax Relief/Local Government4831,690-2,173 Statewide Expenditures1,963428-2,391 Total$122,609$45,032$3,086$170,727 Note: Numbers may not add due to SUM-062016-17 Total State Expenditures by Agency(Dollars in Millions) Transportation ($11,626) Health ($33,059) Human Services ($19,482) Corrections and Rehabilitation ($13,306) K- 12 Education ($51,441) Higher Education ($14,902) Other ($26,911) Figure SUM-07 2016 -17 Total State Expenditures (Including Selected Bond Funds) (Dollars in Millions)
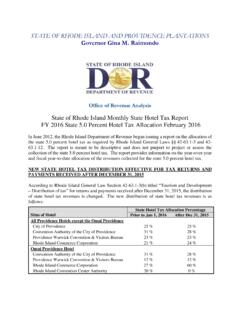
5 Governor s Budget Summary 2016 -17 Summary Charts18uEYnqQoZ1215 ChangeGeneralSpecialFromFundFundsTotal20 15-16 Personal Income Tax$83,841$2,051$85,892$2,510 Sales and Use Tax25,94212,52538,467118 Corporation Tax10,956-10,956652 Highway Users Taxes-4,7304,730-226 Insurance Tax2,549-2,54956 Alcoholic Beverage Taxes and Fees373-3737 Cigarette Tax81709790-23 Motor Vehicle Fees227,8087,8301,223 Other42518,48118,906-1,411 Subtotal$124,189$46,304$170,493$2,906 Transfer to the Budget Stabilization Account/Rainy Day Fund-3,5563,55600 Total$120,633$49,860$170,493$2,906 Note: Numbers may not add due to Total Revenue Sources(Dollars in Millions)Figure SUM-08 Alcoholic Beverage Taxes and Fees ($373) Corporation Tax ($10,956) Cigarette Tax ($790) Insurance Tax ($2,549) Motor Vehicle Fees ($7,830) Highway Users Taxes ($4,730) Personal Income Tax ($85,892) Sales and Use Tax ($38,467) Other ($18,906) Figure SUM-09 2016 -17 Total Revenues and Transfers (Dollars in Millions)