Transcription of Summary for Policymakers - IPCC
1 A report of Working Group I of the Intergovernmental Panel on Climate ChangeSummary for PolicymakersDrafting Authors:Richard B. Alley, Terje Berntsen, Nathaniel L. Bindoff, Zhenlin Chen, Amnat Chidthaisong, Pierre Friedlingstein, Jonathan M. Gregory, Gabriele C. Hegerl, Martin Heimann, Bruce Hewitson, Brian J. Hoskins, Fortunat Joos, Jean Jouzel, Vladimir Kattsov, Ulrike Lohmann, Martin Manning, Taroh Matsuno, Mario Molina, Neville Nicholls, Jonathan Overpeck, Dahe Qin, Graciela Raga, Venkatachalam Ramaswamy, Jiawen Ren, Matilde Rusticucci, Susan Solomon, Richard Somerville, Thomas F. Stocker, Peter A. Stott, Ronald J. Stouffer, Penny Whetton, Richard A. Wood, David WrattDraft Contributing Authors:J. Arblaster, G. Brasseur, Christensen, Denman, Fahey, P. Forster, E. Jansen, Jones, R. Knutti, H. Le Treut, P. Lemke, G. Meehl, P. Mote, Randall, Stone, Trenberth, J. Willebrand, F.
2 Zwiers This Summary for Policymakers should be cited as:IPCC, 2007: Summary for Policymakers . In: Climate Change 2007: The Physical Science Basis. Contribution of Working Group I to the Fourth Assessment Report of the Intergovernmental Panel on Climate Change [Solomon, S., D. Qin, M. Manning, Z. Chen, M. Marquis, Averyt, and Miller (eds.)]. Cambridge University Press, Cambridge, United Kingdom and New York, NY, for Policymakers IntroductionThe Working Group I contribution to the IPCC Fourth Assessment Report describes progress in understanding of the human and natural drivers of climate change,1 observed climate change, climate processes and attribution, and estimates of projected future climate change. It builds upon past IPCC assessments and incorporates new fi ndings from the past six years of research. Scientifi c progress since the Third Assessment Report (TAR) is based upon large amounts of new and more comprehensive data, more sophisticated analyses of data, improvements in understanding of processes and their simulation in models and more extensive exploration of uncertainty basis for substantive paragraphs in this Summary for Policymakers can be found in the chapter sections specifi ed in curly and Natural Driversof Climate ChangeChanges in the atmospheric abundance of greenhouse gases and aerosols, in solar radiation and in land surface properties alter the energy balance of the climate system.
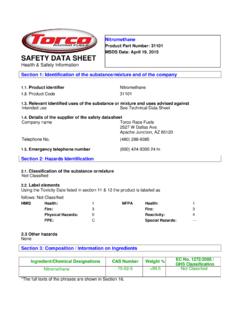
3 These changes are expressed in terms of radiative forcing,2 which is used to compare how a range of human and natural factors drive warming or cooling infl uences on global climate. Since the TAR, new observations and related modelling of greenhouse gases, solar activity, land surface properties and some aspects of aerosols have led to improvements in the quantitative estimates of radiative atmospheric concentrations of carbon dioxide, methane and nitrous oxide have increased markedly as a result of human activities since 1750 and now far exceed pre-industrial values determined from ice cores spanning many thousands of years (see Figure ). The global increases in carbon dioxide concentration are due primarily to fossil fuel use and land use change, while those of methane and nitrous oxide are primarily due to agriculture.
4 { , , } Carbon dioxide is the most important anthropogenic greenhouse gas (see Figure ). The global atmospheric concentration of carbon dioxide has increased from a pre-industrial value of about 280 ppm to 379 ppm3 in 2005. The atmospheric concentration of carbon dioxide in 2005 exceeds by far the natural range over the last 650,000 years (180 to 300 ppm) as determined from ice cores. The annual carbon dioxide concentration growth rate was larger during the last 10 years (1995 2005 average: ppm per year), than it has been since the beginning of continuous direct atmospheric measurements (1960 2005 average: ppm per year) although there is year-to-year variability in growth rates. { , } The primary source of the increased atmospheric concentration of carbon dioxide since the pre-industrial period results from fossil fuel use, with land-use change providing another signifi cant but smaller contribution.
5 Annual fossil carbon dioxide emissions4 increased from an average of [ to ]5 GtC ( [ to ] GtCO2) per year in the 1990s to [ to ] GtC ( [ to ] GtCO2) per year in 2000 2005 (2004 and 2005 data are interim estimates). Carbon dioxide emissions associated with land-use change 1 Climate change in IPCC usage refers to any change in climate over time, whether due to natural variability or as a result of human activity. This usage differs from that in the United Nations Framework Convention on Climate Change, where climate change refers to a change of climate that is attributed directly or indirectly to human activity that alters the composition of the global atmosphere and that is in addition to natural climate variability observed over comparable time Radiative forcing is a measure of the infl uence that a factor has in altering the balance of incoming and outgoing energy in the Earth-atmosphere system and is an index of the importance of the factor as a potential climate change mechanism.
6 Positive forcing tends to warm the surface while negative forcing tends to cool it. In this report, radiative forcing values are for 2005 relative to pre-industrial conditions defi ned at 1750 and are expressed in watts per square metre (W m 2). See Glos-sary and Section for further ppm (parts per million) or ppb (parts per billion, 1 billion = 1,000 million) is the ratio of the number of greenhouse gas molecules to the total number of molecules of dry air. For example, 300 ppm means 300 molecules of a greenhouse gas per million molecules of dry Fossil carbon dioxide emissions include those from the production, distribution and consumption of fossil fuels and as a by-product from cement production. An emission of 1 GtC corresponds to In general, uncertainty ranges for results given in this Summary for Policymakers are 90% uncertainty intervals unless stated otherwise, that is, there is an estimated 5% likelihood that the value could be above the range given in square brackets and 5% likelihood that the value could be below that range.
7 Best estimates are given where available. Assessed uncertainty intervals are not always symmetric about the corresponding best estimate. Note that a number of uncertainty ranges in the Working Group I TAR corresponded to 2 standard deviations (95%), often using expert for Policymakers 3 Figure Atmospheric concentrations of carbon dioxide, methane and nitrous oxide over the last 10,000 years (large panels) and since 1750 (inset panels). Measurements are shown from ice cores (symbols with different colours for different studies) and atmospheric samples (red lines). The corresponding radiative forcings are shown on the right hand axes of the large panels. {Figure }are estimated to be [ to ] GtC ( [ to ] GtCO2) per year over the 1990s, although these estimates have a large uncertainty. { } The global atmospheric concentration of methane has increased from a pre-industrial value of about 715 ppb to 1732 ppb in the early 1990s, and was 1774 ppb in 2005.
8 The atmospheric concentration of methane in 2005 exceeds by far the natural range of the last 650,000 years (320 to 790 ppb) as determined from ice cores. Growth rates have declined since the early 1990s, consistent with total emissions (sum of anthropogenic and natural sources) being nearly constant during this period. It is very likely6 that the observed increase in methane concentration is due to anthropogenic activities, predominantly agriculture and fossil fuel use, but relative contributions from different source types are not well determined. { , } The global atmospheric nitrous oxide concentration increased from a pre-industrial value of about 270 ppb to 319 ppb in 2005. The growth rate has been approximately constant since 1980. More than a third of all nitrous oxide emissions are anthropogenic and are primarily due to agriculture.
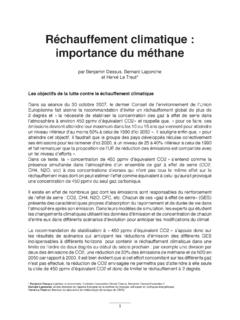
9 { , }The understanding of anthropogenic warming and cooling infl uences on climate has improved since the TAR, leading to very high confi dence7 that the global average net effect of human activities since 1750 has been one of warming, with a radiative forcing of + [+ to + ] W m 2 (see Figure ). { , , } The combined radiative forcing due to increases in carbon dioxide, methane , and nitrous oxide is + [+ to + ] W m 2, and its rate of increase during the industrial era is very likely to have been unprecedented in more than 10,000 years (see Figures CHANGES IN GREENHOUSE GASES FROM ICE CORE AND MODERN DATA6 In this Summary for Policymakers , the following terms have been used to indicate the assessed likelihood, using expert judgement, of an outcome or a result: Virtually certain > 99% probability of occurrence, Extremely likely > 95%, Very likely > 90%, Likely > 66%, More likely than not > 50%, Unlikely < 33%, Very unlikely < 10%, Extremely unlikely < 5% (see Box for more details).)
10 7 In this Summary for Policymakers the following levels of confi dence have been used to express expert judgements on the correctness of the underly-ing science: very high confi dence represents at least a 9 out of 10 chance of being correct; high confi dence represents about an 8 out of 10 chance of being correct (see Box ) 4 Summary for Policymakers Figure Global average radiative forcing (RF) estimates and ranges in 2005 for anthropogenic carbon dioxide (CO2), methane (CH4), nitrous oxide (N2O) and other important agents and mechanisms, together with the typical geographical extent (spatial scale) of the forcing and the assessed level of scientifi c understanding (LOSU). The net anthropogenic radiative forcing and its range are also shown. These require summing asymmetric uncertainty estimates from the component terms, and cannot be obtained by simple addition.