Transcription of Summary of Estimated Water Use in the United States in 2015
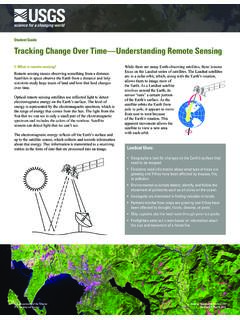
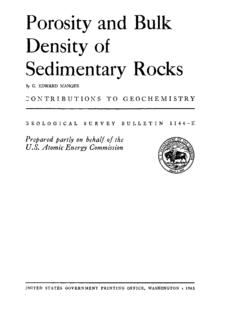
1 Department of the Geological SurveyFact Sheet 2018-3035 June 2018 Summary of Estimated Water Use in the United States in 2015 TAC18-1232_pie chartPublic supply domestic 118 Livestock power 1332015 withdrawals by category,in billion gallons per day Total withdrawals in 2015, were 322 billion gallons per day (Bgal/d), resulting in a 9 percent decrease since 2010 Since 2010, population increased 4 percent and total domestic use decreased 3 percent, which reduced per-capita use to 82 gallons per day Consumptive use accounted for 62 percent of Water used for irrigation , and 3 percent of Water used for thermoelectric power in 2015 Withdrawals for thermoelectric power, irrigation , and public supply accounted for 90 percent of total withdrawals in 2015A total of 322 Bgal/d of Water withdrawals was reported for eight categories of use in the United States in 2015, which was 9 percent less than in 2010 (354 Bgal/d), and continued a declining trend since 2005.
2 The decline in total withdrawals in 2015 primarily was caused by significant decreases ( Bgal/d) in thermoelectric power, which accounted for 89 percent of the decrease in total withdrawals. Between 2010 and 2015, withdrawals decreased in all categories except irrigation (2 percent increase), mining (1 percent increase), and livestock (no change). Fresh surface- Water withdrawals (198 Bgal/d) were 14 percent less than in 2010, and fresh groundwater withdrawals ( Bgal/d) were about 8 percent more than in 2010. Saline surface- Water withdrawals ( Bgal/d) were 14 percent less than in 2010, and saline groundwater withdrawals ( Bgal/d) were 5 percent more than in 2010.
3 Total population in the United States in 2015 (325 million) increased by 4 percent ( million) from 2010, which was similar to the increase between 2005 and 2010. For the first time since 1995, consumptive use for irrigation and thermoelectric power were reported. Consumptive use accounted for 62 percent ( Bgal/d) of Water used for irrigation , and 3 percent ( Bgal/d) of Water used for thermoelectric power in 2015. Water Use by CategoryWithdrawals for thermoelectric power, irrigation and public supply accounted for 90 percent of total withdrawals in the United States . Withdrawals by category and State, arranged from west to east (fig. 1) indicate the general geographical pattern of Water use across the country.
4 Thermoelectric-power withdrawals were prominent in the east and irrigation withdrawals were prominent in the west. Public-supply withdrawals are greatest in the States with the largest population centers. Withdrawals for public supply were about 12 percent ( Bgal/d) of total withdrawals, and 61 percent of public-supply withdrawals were from surface- Water sources. Public-supply systems deliver Water to domestic, industrial, commercial, and other users, and 60 percent of public-supply withdrawals provided 87 percent of the United States population (283 million) for domestic indoor and outdoor residential uses. Other residences are self-supplied from wells or other sources; these withdrawals were about 1 percent ( Bgal/d) of total withdrawals and provided Water to about 13 percent ( million) of the United States population.
5 Groundwater was used for 98 percent of the self-supplied domestic withdrawals. Withdrawals for irrigation were 37 percent (118 Bgal/d) of total withdrawals, and 42 percent of freshwater withdrawals. Lands irrigated with sprinkler or micro- irrigation systems accounted for 63 percent of total irrigated lands. Surface Water supplied about 52 percent of the total irrigation withdrawals. The 17 conterminous Western States accounted for 81 percent of total irrigation withdrawals, and 74 percent of the total irrigated lands in the United States . Withdrawals for livestock and aquaculture combined were 3 percent of the total withdrawals for all categories in 2015. Total withdrawals for livestock were Bgal/d and 62 percent was from groundwater.
6 Total withdrawals for aquaculture were Bgal/d and 79 percent were from surface industrial withdrawals were almost 5 percent ( Bgal/d) of total withdrawals, and surface Water provided 82 percent. Withdrawals for mining were about 1 percent ( Bgal/d) of total withdrawals, and groundwater supplied 72 percent, mostly (65 percent) from saline used for thermoelectric power accounted for 41 percent of total withdrawals (133 Bgal/d), and surface Water supplied almost all withdrawals; 72 percent of the surface- Water withdrawals were freshwater. Powerplants that used once-through cooling systems accounted for 96 percent of all thermoelectric-power withdrawals. More than 25 percent of thermoelectric-power withdrawals and power production was in Texas, Florida, Illinois, and Michigan.
7 Water Use Trends, 1950-2015 Every 5 years since 1950, the Geological Survey (USGS) has compiled and Estimated Water -use information in cooperation with State, Federal, and local agencies, making it possible to evaluate Water -use trends through time. Total withdrawals steadily increased from 1950 (180 Bgal/d) to the peak in 1980 (430 Bgal/d), declined in 1985 (397 Bgal/d), and then remained fairly steady until 2005 (410 Bgal/d). The sharp decline in 2010 (354 Bgal/d) has continued through 2015 (322 Bgal/d). Total withdrawals for 2015 were lower than 1970, and were about the same as 1965 (310 Bgal/d). Thermoelectric-power withdrawals increased from 1950 to 1980, then fluctuated slightly through 2005, and since 2005 have declined sharply because of increased efficiency and closures of plants with once-through cooling systems.
8 irrigation withdrawals steadily increased from 1950 to 1980, when they peaked (150 Bgal/d), then remained steady through 2005 (127 Bgal/d), declined in 2010 (116 Bgal/d) and slightly increased in 2015 (118 Bgal/d). The trend toward using more efficient irrigation systems continued with 10 percent more irrigated lands using sprinkler systems (including micro- irrigation ) in 2015 than in 2010; lands using surface (flood) irrigation systems decreased by 11 percent. Although population within the United States has steadily increased since 1950, public-supply withdrawals have varied. Public-supply withdrawals gradually increased from 1950 (14 Bgal/d), to a peak in 2005 ( Bgal/d), decreased for the first time in 2010 ( Bgal/d), and have continued to decrease at 7 percent in 2015 ( Bgal/d).
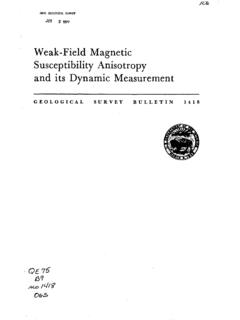
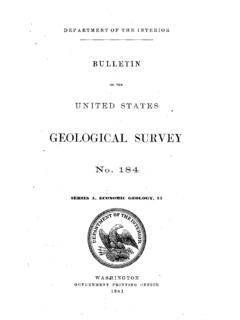
9 Less Water was used for domestic purposes in 2015 than in 2010, which resulted in a decrease of the total domestic per-capita use rate from 88 gallons per capita per day (GPCD) in 2010, to 82 GPCD in 2015. Trends for combined categories of industrial, mining, aquaculture, livestock, and commercial (reported from 1985 to 1995), show that total combined withdrawals were steady from 1950 to 1985, then ,00020,00030,000 HawaiiAlaskaOregonWashingtonCaliforniaNe vadaIdahoArizonaUtahMontanaWyomingNew MexicoColoradoNorth DakotaSouth DakotaNebraskaTexasKansasOklahomaMinneso taIowaMissouriLouisianaArkansasWisconsin MississippiIllinoisAlabamaTennesseeIndia naKentuckyMichiganGeorgiaOhioFloridaSout h CarolinaWest VirginiaNorth YorkDelawareNew JerseyConnecticutVermontMassachusettsRho de IslandNew HampshireMainePuerto Virgin IslandsTotal withdrawals, in million gallons per dayWESTEASTP ublic supplyOtherIrrigationIndustrialThermoele ctric powerEXPLANATIONF igure 1.
10 Withdrawals by category in 2015. States are arranged geographically from west to east. Units are in million gallons per day (Mgal/d); 1 billion gallon per day is equal to 1,000 Mgal/d. decreased in 1985, mostly because of large decreases in industrial withdrawals between 1980 and 1985. This decreasing trend has continued until 2015, even though livestock, mining, and aquaculture uses have increased over of Water -Use Data for the United StatesThe most recent USGS publication of Water -use data that is part of the series of reports that began in 1950, and is the basis of this Summary , is USGS Circular 1441, Estimated use of Water in the United States in 2015 (Dieter and others, 2018) along with a data release (Dieter and others, 2017).