Transcription of Surftest (Surface Roughness Testers)
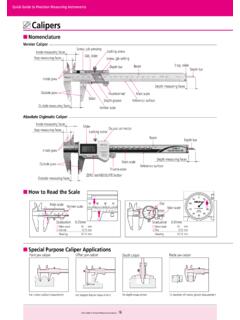
1 38 Quick Guide to Precision Measuring InstrumentsQuick Guide to Precision Measuring InstrumentsSurftest (Surface Roughness Testers) JIS B 0601: 2001 Geometric Product Specifications (GPS) Surface Texture: Profile method Terms, definitions, and surface texture parameters JIS B 0632: 2001 Geometric Product Specifications (GPS) Surface Texture: Profile method Metrological characterization of phase-correct filters JIS B 0633: 2001 Geometric Product Specifications (GPS) Surface Texture: Profile method Rules and procedures for the assessment of surface texture JIS B 0651: 2001 Geometric Product Specifications (GPS) Surface Texture: Profile method Nominal characteristics of contact (stylus) instrumentsFeed deviceColumnProbe (pickup)ProbeStylusWorkpieceFixtureBaseM easuring loopTransducerMeasure-mentprofileStylus tipReferencelineReferenceguide skidNominaltexturesuppressionPrimaryprof ileADconverterProfilefilterParameter evaluation according to JIS B 0601 AmplifierFeeddeviceWorkpiecesurfaceMeasu re-mentloopAppea-ranceDrive UnitZ-axis Signal Transfer UnitInput/OutputInput/OutputQuantizedmea sure-mentprofileQuantizedmeasure-mentpro fileA profile filter is a phase-correct filter without phase delay (cause of profile distortion dependent on wavelength).
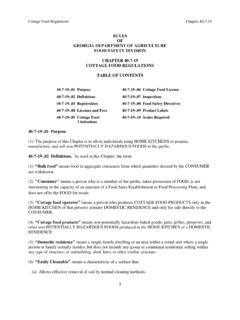
2 The weight function of a phase-correct filter shows a normal (Gaussian) distribution in which the amplitude transmission is 50% at the cutoff wavelength. Nominal Characteristics of Contact (Stylus) Instruments Data Processing Flow Surface Profiles Metrological Characterization of Phase Correct FiltersSurface profileon the real surfaceMeasuredprofileQuantizedprofilePr imary profilePrimary profileparametersRoughness profileWaviness profileRoughnessprofile parametersWavinessprofile parametersLow-pass filterof cutoff value sHigh-pass filter of cutoff value cBand-pass filter that passes wavelengthsbetween cutoff values c and fMeasurementAD conversionSuppresses irrelevant geometry of the surface such as inclination of a flat feature and curvature of a cylindrical feature using the least squares : Profile that results from the intersection of the real surface and a plane rectangular to : Locus of the center of the stylus tip that traces the workpiece : Data obtained by quantizing the measured B 0651: 2001 (ISO 3274: 1996)JIS B 0632: 2001(ISO 11562.)
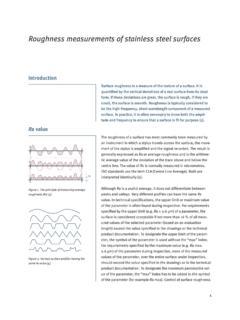
3 1996)60 60 60 90 90 90 R2 mR5 mR10 mR2 mR5 mR10 mStylus ShapeA typical shape for a stylus end is conical with a spherical radius: rtip = 2 m, 5 m or 10 mTaper angle of cone: 60 , 90 In typical surface Roughness testers, the taper angle of the stylus end is 60 unless otherwise Measuring ForceMeasuring force at the mean position of a stylus: of measuring force variations: 0N/mStandard characteristic value: Static measuring force at the mean position of a stylusNote 1: The maximum value of static measuring force at the average position of a stylus is to be for a special structured probe including a replaceable radius ofcurvature of stylus tip: mStatic measuring force atthe mean position ofstylus: mNToleranced ratio of staticmeasuring forcevariations: mN/ ( ) Note Maximum sampling lengthmm cmm s m c/ sRelationship between Cutoff Value and Stylus Tip RadiusThe following table lists the relationship between the Roughness profile cutoff value c, stylus tip radius rtip, and cutoff ratio c/ 1: For a surface with Ra> m or Rz>3 m, a significant error will not usually occur in a measurement even if rtip= 5 2: If a cutoff value ls is m or 8 m, attenuation of the signal due to the mechanical filtering effect of a stylus with the recommended tip radius appears outside the Roughness profile pass band.
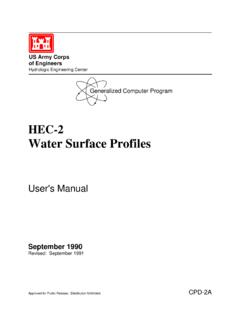
4 Therefore, a small error in stylus tip radius or shape does not affect parameter values calculated from measurements. If a specific cutoff ratio is required, the ratio must be rtip mNote 1 Note 2 Note 2 8 8 25 5 30 100 300 300 300 2 2 2 5 10 JIS B 0601: 2001 (ISO 4287: 1997)50100 s c fAmplitude transmission %WavelengthRoughness profileWaviness profilePrimary ProfileProfile obtained from the measured profile by applying a low-pass filter with cutoff value ProfileProfile obtained from the primary profile by suppressing the longer wavelength components using a high-pass filter of cutoff value ProfileProfile obtained by applying a band-pass filter to the primary profile to remove the longer wavelengths above f and the shorter wavelengths below c. Definition of ParametersRpSampling lengthAmplitude Parameters (peak and valley)Maximum peak height of the primary profile PpMaximum peak height of the Roughness profile RpMaximum peak height of the waviness profile WpLargest profile peak height Zp within a sampling lengthJIS B 0601 : 2001(ISO 4287 : 1997)Sampling lengthRvMaximum valley depth of the primary profile PvMaximum valley depth of the Roughness profile RvMaximum valley depth of the waviness profile WvLargest profile valley depth Zv within a sampling lengthRpSampling lengthRzRvMaximum height of the primary profile PzMaximum height of the Roughness profile RzMaximum height of the waviness profile WzSum of height of the largest profile peak height Zp and the largest profile valley depth Zv within a sampling length In Old JIS and ISO 4287-1: 1984, Rz was used to indicate the ten point height of irregularities.
5 Care must be taken because differences between results obtained according to the existing and old standards are not always negligibly small. (Be sure to check whether the drawing instructions conform to existing or old standards.)Mean height of the primary profile elements PcMean height of the Roughness profile elements RcMean height of the waviness profile elements WcMean value of the profile element heights Zt within a sampling lengthmmPc, Rc, Wc = Ztii=11 Sampling lengthZt1Zt2Zt3Zt4Zt5Zt6 Total height of the primary profile PtTotal height of the Roughness profile RtTotal height of the waviness profile WtSum of the height of the largest profile peak height Zp and the largest profile valley depth Zv within the evaluation lengthEvaluation lengthSamplinglengthRtRzRzRz Primary profilePrimary profile39 Quick Guide to Precision Measuring Instruments JIS B 0601: 2001 Geometric Product Specifications (GPS) Surface Texture: Profile method Terms, definitions, and surface texture parameters JIS B 0632: 2001 Geometric Product Specifications (GPS) Surface Texture: Profile method Metrological characterization of phase-correct filters JIS B 0633.
6 2001 Geometric Product Specifications (GPS) Surface Texture: Profile method Rules and procedures for the assessment of surface texture JIS B 0651: 2001 Geometric Product Specifications (GPS) Surface Texture: Profile method Nominal characteristics of contact (stylus) instrumentsmmPSm, RSm, WSm = XSii=11 Amplitude Parameters (average of ordinates)Arithmetical mean deviation of the primary profile PaArithmetical mean deviation of the Roughness profile RaArithmetical mean deviation of the waviness profile WaArithmetic mean of the absolute ordinate values Z(x) within a sampling lengthllPa, Ra, Wa = Z(x) dx01lnPmr(c), Rmr(c), Wmr(c) =Ml(c)Ra75 = Z(x) dxlnln01 RzJIS =5Zp1+Zp2+Zp3+Zp4+Zp5 + Zv1+Zv2+Zv3+Zv4+Zv5with l as lp, lr, or lw according to the l as lp, lr, or lw according to the mean square deviation of the primary profile PqRoot mean square deviation of the Roughness profile RqRoot mean square deviation of the waviness profile WqRoot mean square value of the ordinate values Z(x)
7 Within a sampling lengthSkewness of the primary profile PskSkewness of the Roughness profile RskSkewness of the waviness profile WskQuotient of the mean cube value of the ordinate values Z(x) and the cube of Pq, Rq, or Wq respectively, within a sampling lengthThe above equation defines Rsk. Psk and Wsk are defined in a similar manner. Psk, Rsk, and Wsk are measures of the asymmetry of the probability density function of the ordinate of the primary profile PkuKurtosis of the Roughness profile RkuKurtosis of the waviness profile WkuQuotient of the mean quartic value of the ordinate values Z(x) and the fourth power of Pq, Rq, or Wq respectively, within a sampling lengthThe above equation defines Rku. Pku and Wku are defined in a similar manner. Pku, Rku, and Wku are measures of the sharpness of the probability density function of the ordinate ParametersMean width of the primary profile elements PSmMean width of the Roughness profile elements RSmMean width of the waviness profile elements WSmMean value of the profile element widths Xs within a sampling lengthSampling lengthXs2Xs1Xs3Xs4Xs5Xs6 Hybrid ParametersRoot mean square slope of the primary profile P qRoot mean square slope of the Roughness profile R qRoot mean square slope of the waviness profile W qRoot mean square value of the ordinate slopes dZ/dX within a sampling lengthdZ (x)dxdZ (x)dxdZ (x)dxdZ (x)dxdZ (x)dxllPq, Rq, Wq = Z2(x)dx01Rq3lrRsk = Z3(x)dx01lr1Rq4lrRku = Z4(x)dx01lr1 Curves, Probability Density Function, and Related ParametersMaterial ratio curve of the profile (Abbott-Firestone curve)Curve representing the material ratio of the profile as a function of section level cSampling length0204060100 Rmr(c)
8 ,%Mean LinecMaterial ratio of the primary profile Pmr(c)Material ratio of the Roughness profile Rmr(c)Material ratio of the waviness profile Wmr(c)Ratio of the material length of the profile elements Ml(c) at a given level c to the evaluation lengthSection height difference of the primary profile PdcSection height difference of the Roughness profile RdcSection height difference of the waviness profile WdcVertical distance between two section levels of a given material ratio0102030405060708090100 Rmr0 Rmrc1c0R cR c = c(Rmr1) c(Rmr2); Rmr1<Rmr2 Relative material ratio of the primary profile PmrRelative material ratio of the Roughness profile RmrRelative material ratio of the waviness profile WmrMaterial ratio determined at a profile section level R c (or P c or W c), related to the reference section level c0 Mean lineEvaluation lengthAmplitude densityPmr, Rmr, Wmr = Pmr(c1), Rmr(c1), Wmr(c1)where c1 = c0 R c(or P c or W c) c0 = c(Pm0, Rmr0, Wmr0)Probability density function (profile height amplitude distribution curve)Sample probability density function of the ordinate Z(x) within the evaluation lengthJIS Specific ParametersTen-point height of irregularities, RzJISSum of the absolute mean height of the five highest profile peaks and the absolute mean depth of five deepest profile valleys, measured from the mean line within the sampling length of a Roughness profile.
9 This profile is obtained from the primary profile using a phase-correct band-pass filter with cutoff values of lc and lengthZv3Zv1Zv2Zv5Zv4 SymbolRzJIS82 RzJIS94 Used profileSurface profile as measuredRoughness profile derived from the primary profile using a phase-correct high-pass filterArithmetic mean deviation of the profile Ra75 Arithmetic mean of the absolute values of the profile deviations from the mean line within the sampling length of the Roughness profile (75%). This profile is obtained from a measurement profile using an analog high-pass filter with an attenuation factor of 12db/oct and a cutoff value of c. Sampling Length for Surface Roughness ParametersJIS B 0633: 2001 (ISO 4288: 1996)Procedure for determining a sampling length if it is not specifiedEstimate Ra, Rz, Rz1max, or RSm accordingto recorded waveforms,visual inspection, a shorter sampling length been tried? Procedure for determining the sampling length of an aperiodic profile if it is not specifiedDoes the measuredvalue meet the conditionof table 3?
10 Change the samplinglength so as to meet the condition of table Procedure for determining the sampling length of a periodic profile if it is not specifiedEstimate the sampling length from anestimated value and Tables 1 to 3 Estimate RSm froma measured Roughness profileEstimate the sampling length froman estimated value and table 3 Measure the parameter accordingto the final sampling lengthMeasure RSm according to the estimatedvalue of the sampling lengthMeasure Ra, Rz, Rzlmax, or RSm according tothe estimated value of the sampling lengthMeasure the parameter accordingto the final sampling lengthChange to a shortersampling lengthChange to a longeror shorter samplinglengthDoes each measuredvalue meet the parameter rangeof table 1, 2, or 3?Does each measuredvalue meet the parameter rangeof table 1, 2, or 3? table 1: Sampling lengths for aperiodic profile Roughness parameters (Ra, Rq, Rsk, Rku, R q), material ratio curve, probability density function, and related parametersTable 2: Sampling lengths for aperiodic profile Roughness parameters (Rz, Rv, Rp, Rc, Rt) table 3: Sampling lengths for measurement of periodic Roughness profile Roughness parameters and periodic or aperiodic profile parameter Rsm1) Rz is used for measurement of Rz, Rv, Rp, Rc, and ) Rzlmax only used for measurement of Rzlmax, Rvlmax, Rplmax, and length m( ) <Rz, Rz1max <Rz, Rz1max ) <Rz, Rz1max 1010 <Rz, Rz1max 5050 <Rz, Rz1max 200 Evaluation length length m( ) <Ra <Ra ) <Ra 22 <Ra 1010 <Ra 80 Evaluation length length <Rsm <Rsm ) <Rsm <Rsm <Rsm 4 Evaluation length