Transcription of Syntax - Stata
1 Twoway kdensity kernel density plotsSyntaxMenuDescriptionOptionsRemarks and examplesReferencesAlso seeSyntaxtwoway kdensityvarname[if][in][weight][,options ]optionsDescriptionbwidth(#)smoothing parameterkernel( kernel )specify kernel function; default iskernel(epanechnikov)range(# #)range for plot, minimum and maximumrange(varname)range for plot obtained fromvarnamen(#)number of points to evaluatearea(#)rescaling parameterhorizontalgraph horizontallyclineoptionschange look of the lineaxischoiceoptionsassociate plot with alternative axistwowayoptionstitles, legends, axes, added lines and text, by, regions, name,aspect ratio, [G-3]clineoptions, [G-3]axischoiceoptions, and [G-3] kernel function; the defaultepan2alternative Epanechnikov kernel functionbiweightbiweight kernel functioncosinecosine trace kernel functiongaussianGaussian kernel functionparzenParzen kernel functionrectanglerectangular kernel functiontriangletriangular kernel functionfweights andaweights are allowed; see[U] >Twoway graph (scatter, line, etc.)
2 12 graph twoway kdensity kernel density plotsDescriptiongraph twoway kdensityplots a kernel density estimate forvarnameusinggraph twoway line;see [G-2]graph twoway (#)andkernel( kernel )specify how the kernel density estimate is to be obtained and arein fact the same options as those specified with the commandkdensity; see [R] (#)specifies the smoothing ( kernel )specify the kernel -weight function to be used. The default iskernel(epanechnikov).See [R]kdensityfor more information about these the othergraph twoway kdensityoptions modify how the result is displayed, not how it (# #)andrange(varname)specify the range of values at which the kernel density estimatesare to be plotted. The default isrange(m M), wheremandMare the minimum and maximumof thevarnamespecified on thegraph twoway (# #)specifies a pair of numbers to be used as the minimum and (varname)specifies another variable for which its minimum and maximum are to be (#)specifies the number of points at which the estimate is evaluated.
3 The default isn(300).area(#)specifies a multiplier by which the density estimates are adjusted before being plotted. Thedefault isarea(1).area()is useful when overlaying a density estimate on top of a histogramthat is itself not scaled as a density . For instance, if you wished to scale the density estimate as afrequency,area()would be specified as the total number of nonmissing that the result be plotted horizontally ( , reflected along the identity line).clineoptionsspecify how the density line is rendered and its appearance; [G-3] the plot with a particularyorxaxis on the graph; see[G-3] a set of common options supported by alltwowaygraphs. These options allowyou to title graphs, name graphs, control axes and legends, add lines and text, set aspect ratios,create graphs overby()groups, and change some advanced settings.
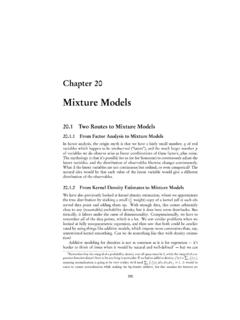
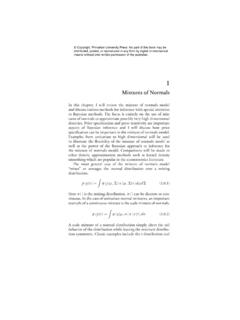
4 See [G-3] and twoway kdensityvarnameuses thekdensitycommand to obtain an estimate of thedensity ofvarnameand usesgraph twoway lineto plot the are presented under the following headings:Typical useUse with by( )graph twoway kdensity kernel density plots 3 Typical useThe density estimate is often graphed on top of the histogram:. use (Life expectancy, 1998). twoway histogram lexp, color(*.5) || kdensity lexpNotice the use ofgraph twoway histogram scolor(*.5)option to dim the bars and make theline stand out; see [G-4] also theyandxaxis titles: density /kdensity lexp and Life expectancy at birth/x . The kdensity lexp and x were contributed by thetwoway kdensity. When you overlay graphs, younearly always need to respecify the axis titles using theaxistitleoptionsytitle()andxtitle();s ee [G-3] graph twoway kdensity kernel density plotsUse with by()graph twoway kdensitymay be used withby().
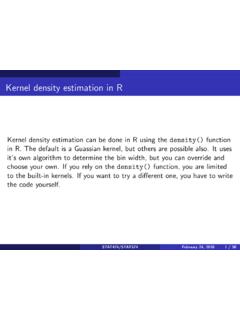
5 Use , clear(Life expectancy, 1998). twoway histogram lexp, color(*.5) || kdensity lexp ||, by(region) & lexpGraphs by RegionReferencesCox, N. J. 2005. Speaking Stata : density probability Journal5: 259 2007. Software Updates: Speaking Stata : density probability Journal7: see[R]kdensity Univariate kernel density estimation [G-2]graph twoway histogram Histogram plots