Transcription of System Health Monitoring - Cisco
1 Cisco Systems, Health MonitoringMonitoring critical System resources is very important to maintain stability of the network. We recommend that you monitor the switch CPU, memory, file systems, and environmental resources on a regular workflow discusses the commonly used commands and procedures to monitor and maintain System for System Health MonitoringObtain information about your switch such as the running software release, duration of switch run time, and the reason for the most recent reload.
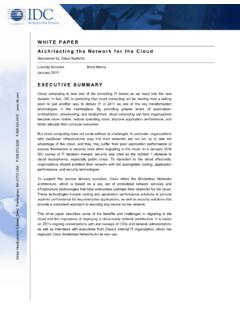
2 To obtain this information, use the show version command. The command with the pipe feature gives the duration of uptime and any reload Running StatusIdentify the reasons for uptime and reload. Over time, switches can crash and reload without your knowledge. Step 1 Use the show version command to retrieve the overall switch status. If you are only interested in the switch uptime and last reload, you can run a more direct command using the pipe | feature built into Cisco IOS XE (and Cisco IOS) software.
3 This example shows that Cisco IOS XE release SE was running for five weeks before a privileged user initiated a switch version|inc software|uptime|LastCisco IOS Software, IOS-XE Software, Catalyst L3 Switch Software (CAT3K_CAA-UNIVERSALK9-M), Version RELEASE SOFTWARE (fc2)3850-access-Bld1 Flr1 uptime is 5 weeks, 3 days, 2 hours, 59 minutesLast reload reason: reloadSystem Health Monitoring Run a System Baseline for Core Resources104 Best Practice User Guide for the Catalyst 3850 and Catalyst 3650 Switch SeriesRun a System Baseline for Core ResourcesSet your System baseline usage during normal production time and determine if there is a change from your expected resource values.
4 If the increase in usage is not justified, investigate to find the cause. Ideally, it is best to setup some form of Network Monitoring System (NMS) to automatically monitor these values, however it is also important to learn how to manually poll these values. After you have identified the switch running status, examine core resources to ensure that they are all at optimal values. Obtain CPU and Core Processor UsageStep 2 Use the show process cpu command to display CPU and core processor usage. To find CPU usage due to the subprocesses and tasks operating under a specific process, use the show process cpu detailed command.
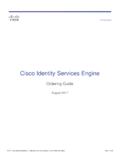
5 To sort for high activity usage, use show process cpu sorted command. CPU usage can be monitored on a per-switch basis in a stacked periodic intervals, we recommend that you run the following variations of the show process cpu switch is a multicore platform that is different from its predecessors. A single core can experience high CPU, so it is important to monitor each core when running these output shows the five-second, one-minute, and five-minute periods on each CPU core. It alsoshows the Forwarding Engine Driver (FED), IOS daemon IOSd, and Wireless Controller Module (WCM) processes have the highest CPU version|inc software|uptime|LastCisco IOS Software, IOS-XE Software, Catalyst L3 Switch Software (CAT3K_CAA-UNIVERSALK9-M), Version RELEASE SOFTWARE (fc2)3850-access-Bld1 Flr1 uptime is 5 weeks, 3 days, 2 hours, 59 minutesLast reload reason.
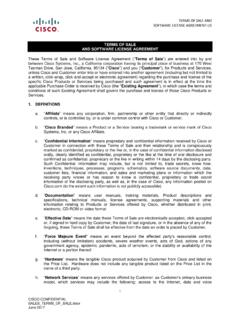
6 ReloadSystem Health Monitoring Run a System Baseline for Core Resources105 Best Practice User Guide for the Catalyst 3850 and Catalyst 3650 Switch SeriesStep 3 Use the history command to display a graph of sustained CPU utilization. This graph helps to formulate patterns. For example, if you observe a spike to 100 percent every 30 minutes, you can conclude that something might be polling the switch on a regular schedule. Examine your SNMP configuration to help determine the : For detailed information to help troubleshoot your high CPU usage concerns, see the Catalyst 3850 Series Switch High CPU Usage Troubleshooting document.
7 Show process cpu sorted | ex 0: CPU utilization for five seconds: 4%; one minute: 5%; five minutes: 5%Core 1: CPU utilization for five seconds: 2%; one minute: 1%; five minutes: 1%Core 2: CPU utilization for five seconds: 0%; one minute: 0%; five minutes: 0%Core 3: CPU utilization for five seconds: 1%; one minute: 2%; five minutes: 1%PID Runtime(ms) Invoked uSecs 5 Sec 1 Min 5 Min TTY Process5639 1598657 15898882 68 1088 fed8503 1554112 10180648 52 0 iosd8499 982266 14501353 18 0 wcm5640 427135 54197163 16 0 platform_mgr6170 502150 9040937 55 0 obfld6177 2057130 87345912 23 0 pdsdshow process cpu historyHistory information for System .
8 1111122222222222222222222 1111111111111111111111111111112222255555 88888888886666666666100 90 80 70 60 50 40 30 ** 20 ** 10 ** 0 5 0 5 0 5 0 5 0 5 CPU% per second (last 60 seconds) System Health Monitoring Run a System Baseline for Core Resources106 Best Practice User Guide for the Catalyst 3850 and Catalyst 3650 Switch SeriesObtain Switch Memory UsageStep 4 Use the show process memory command to display the state of memory usage on your find memory usage due to the subprocesses and tasks operating under a specific process, use the show process memory detailed command.
9 To sort for high activity usage, use the show process memory detailed sorted usage can be monitored on a per-switch basis in a stacked File Systems UsageStep 5At regular intervals, use the show file systems command to monitor the file systems within the switch to ensure that there is always sufficient space available. Unlike previous platforms, the switch writes crash files to a separate directory. For example, the show file systems command output shows that the crashifo folder is populated.
10 Compare the size of the folder against the free space available. The switch has different file systems that can be listed by using the show file systems (*) asterisk indicates the default file System . If the file System has a dash (-) or a zero (0) for the Size(b) field, that indicates that the file System is not present or not 6 Use the dir filesystem or the show filesystem command to list the files under a specific files System . When you find crash files, it is important to immediately retrieve them to diagnose a System failure or unexpected process memory sortedSystem memory : 3930840K total, 1487028K used, 2443812K free, 222004K kernel reservedLowest(b).