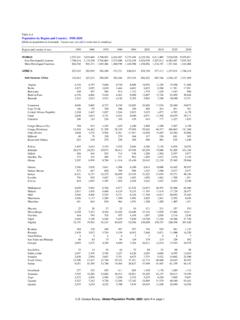
Transcription of Table 1. Apportionment Population and Number of ...
1 Department of Commerce census Bureau Table 1. Apportionment Population AND Number OF REPRESENTATIVES BY STATE: 2020 census . Number OF. APPORTIONED. Apportionment REPRESENTATIVES CHANGE FROM. Population BASED ON 2010 census . STATE (APRIL 1, 2020) 2020 CENSUS2 Apportionment . Alabama 5,030,053 7 0. Alaska 736,081 1 0. Arizona 7,158,923 9 0. Arkansas 3,013,756 4 0. California 39,576,757 52 -1. Colorado 5,782,171 8 1. Connecticut 3,608,298 5 0. Delaware 990,837 1 0. Florida 21,570,527 28 1. Georgia 10,725,274 14 0. Hawaii 1,460,137 2 0. Idaho 1,841,377 2 0. Illinois 12,822,739 17 -1. Indiana 6,790,280 9 0. Iowa 3,192,406 4 0. Kansas 2,940,865 4 0. Kentucky 4,509,342 6 0.
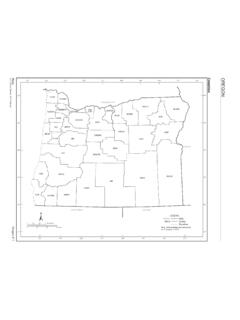
2 Louisiana 4,661,468 6 0. Maine 1,363,582 2 0. Maryland 6,185,278 8 0. Massachusetts 7,033,469 9 0. Michigan 10,084,442 13 -1. Minnesota 5,709,752 8 0. Mississippi 2,963,914 4 0. Missouri 6,160,281 8 0. Montana 1,085,407 2 1. Nebraska 1,963,333 3 0. Nevada 3,108,462 4 0. New Hampshire 1,379,089 2 0. New Jersey 9,294,493 12 0. New Mexico 2,120,220 3 0. New York 20,215,751 26 -1. North Carolina 10,453,948 14 1. North Dakota 779,702 1 0. Ohio 11,808,848 15 -1. Oklahoma 3,963,516 5 0. Oregon 4,241,500 6 1. Pennsylvania 13,011,844 17 -1. Rhode Island 1,098,163 2 0. South Carolina 5,124,712 7 0. South Dakota 887,770 1 0. Tennessee 6,916,897 9 0. Texas 29,183,290 38 2.
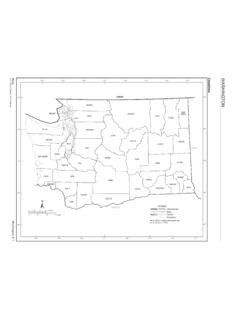
3 Utah 3,275,252 4 0. Vermont 643,503 1 0. Virginia 8,654,542 11 0. Washington 7,715,946 10 0. West Virginia 1,795,045 2 -1. Wisconsin 5,897,473 8 0. Wyoming 577,719 1 0. TOTAL Apportionment POPULATION1 331,108,434 435. Footnotes: 1. Includes the resident Population for the 50 states, as ascertained by the Twenty-Fourth Decennial census under Title 13, United States Code, and counts of military and federal civilian employees living overseas (and their dependents living with them overseas) allocated to their home state, as reported by the employing federal agencies. The Apportionment Population excludes the Population of the District of Columbia. The counts of overseas personnel (and dependents) are used for Apportionment purposes only.
4 2. The census Bureau prepared these calculations using the existing size of the house of Representatives (435 members). and the Method of Equal Proportions, as provided for in Title 2, United States Code, Sections 2a and 2b.