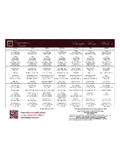
Transcription of Table 1. U.S. Petroleum Balance Sheet, Week Ending 1/7/2022
1 Table 1. Petroleum Balance Sheet, week Ending 1/7/2022 . Current week Ago Year Ago Petroleum Stocks week (Million Barrels) Percent Percent 12/31/21 Difference 1/8/21 Difference 1/7/22 Change Change Crude Oil .. 1, 1, 1, Commercial (Excluding SPR)1 .. Strategic Petroleum Reserve (SPR)2 .. Total Motor Gasoline3 .. Reformulated .. Conventional .. Blending Components .. Fuel Ethanol .. Kerosene-Type Jet Fuel .. Distillate Fuel Oil3 .. 15 ppm sulfur and Under3 .. > 15 ppm to 500 ppm sulfur .. > 500 ppm sulfur .. Residual Fuel Oil .. Propane/Propylene4 .. Other Oils5 .. Unfinished Oils .. Total Stocks (Including SPR)2,3,4 .. 1, 1, 1, Total Stocks (Excluding SPR)3,4 .. 1, 1, 1, Current week Ago Year Ago Four- week Averages Cumulative Daily Average Petroleum Supply week week Ending (Thousand Barrels per Day) Percent 12/31/21 Difference 1/8/21 Difference Percent 1/7/22 1/8/21.
2 1/7/22 1/7/22 1/8/21 Change Change Crude Oil Supply (1) Domestic Production6 .. 11,700 11,800 -100 11,000 700 11,725 11,000 11,700 11,000 (2) Alaska .. 460 459 1 511 -51 456 513 460 511 (3) Lower 48 .. 11,200 11,300 -100 10,500 700 11,250 10,500 11,200 10,500 (4) Net Imports (Including SPR) .. 4,114 3,330 784 3,228 886 3,647 2,283 4,114 3,228 (5) Imports .. 6,069 5,884 185 6,239 -170 6,227 5,625 6,069 6,239 (6) Commercial Crude Oil .. 6,069 5,884 185 6,239 -170 6,227 5,625 6,069 6,239 (7) Imports by SPR .. 0 0 0 0 0 0 0 0 0 (8) Imports into SPR by Others .. 0 0 0 0 0 0 0 0 0 (9) Exports .. 1,955 2,554 -599 3,011 -1,056 2,579 3,342 1,955 3,011 (10) Stock Change (+/build; -/draw) .. -693 -499 -195 -464 -229 -733 -639 -693 -464.
3 (11) Commercial Stock Change .. -650 -306 -344 -464 -187 -535 -639 -650 -464 . (12) SPR Stock Change .. -43 -192 149 0 -43 -198 0 -43 0 . (13) Adjustment7 .. -934 238 -1,172 -42 -892 -365 410 -934 -42 . (14) Crude Oil Input to Refineries .. 15,573 15,867 -293 14,650 923 15,740 14,332 15,573 14,650 Other Supply (15) Production .. 7,872 7,724 147 7,225 647 7,761 7,210 7,872 7,225 (16) Natural Gas Plant Liquids8 .. 5,713 5,540 173 5,309 405 5,583 5,309 5,713 5,309 (17) Renewable Fuels/Oxygenate Plant 1,174 1,178 -4 964 210 1,180 970 1,174 964 (18) Fuel Ethanol .. 1,006 1,048 -42 941 66 1,041 946 1,006 941 (19) Other9 .. 167 130 37 23 144 139 23 167 23 (20) Refinery Processing Gain .. 984 1,006 -21 952 32 997 932 984 952 (21) Net Imports10.
4 -2,820 -2,383 -437 -3,342 522 -3,112 -3,520 -2,820 -3,342 . (22) Imports10 .. 1,845 1,678 167 1,787 58 1,930 1,822 1,845 1,787 (23) Exports10 .. 4,665 4,061 604 5,129 -464 5,042 5,342 4,665 5,129 (24) Stock Change (+/build; -/draw)3,11 10 1,758 -1,748 -882 893 -187 -553 10 -882 . (25) Adjustment12 .. 214 216 -2 191 23 215 191 214 191 . Products Supplied (26) Total13 .. 20,829 19,665 1,164 19,607 1,222 20,792 18,766 20,829 19,607 (27) Finished Motor Gasoline14 .. 7,906 8,172 -265 7,532 374 8,697 7,781 7,906 7,532 (28) Kerosene-Type Jet Fuel .. 1,606 1,468 138 1,468 138 1,531 1,199 1,606 1,468 (29) Distillate Fuel Oil .. 3,749 3,739 10 3,609 140 3,841 3,580 3,749 3,609 (30) Residual Fuel Oil.
5 240 307 -67 239 1 379 210 240 239 (31) Propane/Propylene .. 1,564 1,745 -181 2,104 -540 1,562 1,713 1,564 2,104 (32) Other Oils15 .. 5,764 4,234 1,529 4,654 1,109 4,782 4,284 5,764 4,654 Net Imports of Crude and Petroleum Products (33) Total .. 1,295 947 347 -114 1,409 535 -1,237 1,295 -114 -1, = Not Applicable. 1 Includes those domestic and Customs-cleared foreign crude oil stocks held at refineries and tank farms or in transit thereto, and in pipelines. 2 Includes stocks held under foreign or commercial storage agreements. 3 Excludes stocks located in the "Northeast Heating Oil Reserve", "Northeast Regional Refined Petroleum Product Reserve", and "State of New York's Strategic Fuels Reserve Program.
6 " For details see Appendix C. 4 Prior to April 10, 2020 this included stocks of propylene held at terminals. 5 Includes weekly data for NGPLs and LRGs (except propane/propylene), kerosene, and asphalt and road oil; and estimated stocks of minor products based on monthly data. 6 Domestic crude oil production includes lease condensate and is estimated using a combination of short-term forecasts for the lower 48 states and the latest available production estimates from Alaska. Weekly crude oil production estimates are rounded to the nearest 100,000 b/d at the and lower 48 state levels. For more details see Appendix B, under "Data Obtained Through Models.". 7 Formerly known as Unaccounted-for Crude Oil, this is a balancing item.
7 See Glossary for further explanation. 8 Formerly known as Natural Gas Liquids Production, prior to June 4, 2010, this included adjustments for fuel ethanol and motor gasoline blending components. 9 Includes denaturants ( Pentanes Plus) and other renewables ( biodiesel). Prior to April 10, 2020 this included other oxygenates ( ETBE and MTBE). 10 Includes finished Petroleum products, unfinished oils, gasoline blending components, fuel ethanol, and NGPLs and LRGs. 11 Includes an estimate of minor product stock change based on monthly data. 12 Includes monthly adjustments for hydrogen and other hydrocarbon production. 13 Total Product Supplied = Crude Oil Input to Refineries (line 14) + Other Supply Production (line 15) + Net Product Imports (line 21) Stock Change (line 24) + Adjustment (line 25).
8 14 See Table 2, footnote #3. 15 Other Oil Product Supplied = Total Product Supplied (line 26) less the product supplied of Finished Motor Gasoline (line 27), Kerosene-Type Jet Fuel (line 28), Distillate Fuel Oil (line 29), Residual Fuel Oil (line 30), and Propane/Propylene (line 31). Notes: Some data estimated (see Sources for clarification). Data may not add to total due to independent rounding. Differences and percent changes are calculated using unrounded numbers. Source: See page 29. 1 Weekly Petroleum Status Report/ energy information Administratio