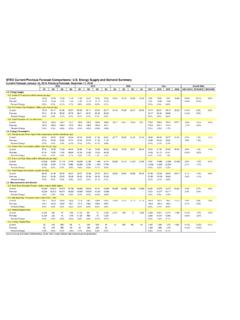
Transcription of Table 3. Capacity of Operable Petroleum Refineries by ...
1 VacuumState/Refiner/Location Barrels perAtmospheric Crude Oil Distillation Capacity Barrels perOperatingIdleOperatingIdleDownstream Charge CapacityThermal CrackingDelayedFluid CokingVisbreakingOther/Gas Calendar DayStream DayDistillationCokingOilTable 3. Capacity of Operable Petroleum Refineries by State as of January 1, 2018 (Barrels per Stream Day, Except Where Noted)..Alabama 141,675 0 150,500 0 47,000 32,000 0 0 0 Goodway refining LLC 4,100 0 5,000 0 0 0 0 0 refining Co 46,000 0 50,000 0 18,000 32,000 0 0 Chemical LP 91,575 0 95,500 0 29,000 0 0 0 158,400 0 178,500 0 26,000 0 0 0 0BP Exploration Alaska Inc 6,000 0 8,000 0 0 0 0 0 BayConocoPhillips Alaska Inc 15,000 0 16,000 0 0 0 0 0 BayPetro Star Inc 19,700 0 22,500 0 0 0 0 0 Pole 55,000 0 60,000 0 0 0 0 0 Alaska Company LLC 62,700 0 72,000 0 26,000 0 0 0 90,500 0 92,700 0 48,850 0 0 0 0 Cross oil refining & Marketing Inc 7,500 0 7,700 0 3.
2 850 0 0 0 Oil Co 83,000 0 85,000 0 45,000 0 0 0 1,892,471 0 2,014,400 0 1,199,756 459,300 52,000 5,000 0 Chevron USA Inc 269,000 0 290,500 0 169,100 76,700 0 0 Segundo 245,271 0 257,200 0 123,456 0 0 0 Oil & refining Co 26,000 0 27,000 0 0 0 0 0 Thagard Co 8,500 0 10,000 0 5,000 0 0 0 GatePhillips 66 Company 120,200 0 128,000 0 93,200 51,000 0 0 139,000 0 147,000 0 82,000 53,200 0 0 Joaquin refining Co Inc 15,000 0 25,000 0 14,300 0 0 5,000 Maria refining Company 9,500 0 10,000 0 10,000 0 0 0 MariaShell Oil Products US 156,400 0 158,000 0 102,000 25,500 22,500 0 refining & Marketing Co 243,800 0 276,000 0 140,000 67,100 0 0 166,000 0 170,000 0 156,900 53,000 0 0 Energy Information Administration, Refinery Capacity 20185 Downstream Charge CapacityCatalytic CrackingCatalytic HydrocrackingCatalytic ReformingFreshRecycledDistillateGas OilResidualLowPressureHighPressureFuels SolventDeasphaltingTable 3.
3 Capacity of Operable Petroleum Refineries by State as of January 1, 2018 State/Refiner/Location (Barrels per Stream Day, Except Where Noted)..Alabama 0 0 0 20,500 0 15,300 22,000 0 Goodway refining 0 0 0 0 0 0 0 0 Hunt refining 0 0 0 20,500 0 15,300 0 0 Shell Chemical 0 0 0 0 0 0 22,000 0 0 0 12,500 0 13,500 0 0BP Exploration Alaska Bay 0 0 0 0 0 0 0 0 ConocoPhillips Alaska Bay 0 0 0 0 0 0 0 0 Petro Star Pole 0 0 0 0 0 0 0 0 0 0 0 0 0 0 0 Tesoro Alaska Company 0 0 0 12,500 0 13,500 0 21,000 0 0 0 0 15,300 0 7,400 Cross oil refining & Marketing 0 0 0 0 0 0 0 0 Lion Oil Dorado 21,000 0 0 0 0 15,300 0 7, 718,500 14,600 197,700 283,400 0 197,800 210,700 56.
4 000 Chevron USA Segundo 73,800 0 0 55,000 0 49,000 0 90,000 0 0 103,400 0 71,300 0 56,000 Kern Oil & refining 0 0 0 0 0 2,500 3,300 0 Lunday Thagard Gate 0 0 0 0 0 0 0 0 Phillips 66 0 0 0 65,000 0 0 34,000 51,600 0 27,500 0 0 0 36,200 0 San Joaquin refining Co 0 0 0 0 0 0 0 0 Santa Maria refining Maria 0 0 0 0 0 0 0 0 Shell Oil Products 72,000 0 42,900 0 0 31,000 0 0 Tesoro refining & Marketing 102,500 0 55,000 0 0 0 47,000 72,000 1,000 0 37,000 0 26,000 0 Energy Information Administration, Refinery Capacity 20186 Downstream Charge CapacityDesulfurization (incl.)
5 Catalytic Hydrotreating)Naphtha/Reformer FeedGasolineKerosene/Jet FuelDiesel FuelOtherDistillateResidualHeavyGas OilOtherTable 3. Capacity of Operable Petroleum Refineries by State as of January 1, 2018 State/Refiner/Location (Barrels per Stream Day, Except Where Noted)..Alabama 40,100 0 20,500 30,000 24,000 0 10,500 0 Goodway refining LLC 0 0 0 0 0 0 0 AtmoreHunt refining Co 12, 0 2,500 0 24,000 0 10,500 0 TuscaloosaShell Chemical LP 28, 0 18,000 30,000 0 0 0 13,000 0 0 11,500 0 0 0 0BP Exploration Alaska Inc 0 0 0 0 0 0 0 Prudhoe BayConocoPhillips Alaska Inc 0 0 0 0 0 0 0 Prudhoe BayPetro Star Inc 0 0 0 0 0 0 0 North Pole 0 0 0 0 0 0 0 ValdezTesoro Alaska Company LLC 13, 0 0 11,500 0 0 0 20,000 8,750 0 35,000 0 0 21,000 13,500 Cross oil refining & Marketing Inc 0 0 0 0 0 0 5.
6 500 SmackoverLion Oil Co 20, 8,750 0 35,000 0 0 21,000 8,000El 424,200 280,500 194,800 335,100 123,100 0 704,100 70,200 Chevron USA Inc 62, 0 41,500 51,500 14,000 0 74,000 0El Segundo 57, 64,800 96,000 64,800 0 0 65,000 34,000 RichmondKern Oil & refining Co 5, 0 0 0 9,000 0 0 0 BakersfieldLunday Thagard Co 0 0 0 0 0 0 0 South GatePhillips 66 Company 27, 0 0 35,000 0 0 0 0 Rodeo 50, 0 12,900 32,000 0 0 55,000 0 WilmingtonSan Joaquin refining Co Inc 0 0 0 3,600 0 1,800 0 BakersfieldSanta Maria refining Company 0 0 0 0 0 0 0 Santa MariaShell Oil Products US 27, 92,500 0 0 49,000 0 84,500 14,500 MartinezTesoro refining & Marketing Co 45, 37,000 10,000 22,000 0 0 95,000 0 Carson 27, 43,000 0 40,000 19,500 0 69,500 Energy Information Administration.
7 Refinery Capacity 20187 VacuumState/Refiner/Location Barrels perAtmospheric Crude Oil Distillation Capacity Barrels perOperatingIdleOperatingIdleDownstream Charge CapacityThermal CrackingDelayedFluid CokingVisbreakingOther/Gas Calendar DayStream DayDistillationCokingOilTable 3. Capacity of Operable Petroleum Refineries by State as of January 1, 2018 (Barrels per Stream Day, Except Where Noted)..California 1,892,471 0 2,014,400 0 1,199,756 459,300 52,000 5,000 0 Tesoro refining & Marketing Co 97,500 0 107,000 0 65,000 42,000 0 0 refining Co LLC 160,000 0 166,200 0 102,300 62,000 0 0 Inc 85,000 0 87,000 0 46,000 28,800 0 0 refining Co California 145,000 0 149,000 0 85,500 0 29,500 0 6,300 0 6,500 0 5,000 0 0 0 103,000 0 111,500 0 33,500 0 0 0 0 Suncor Energy (USA)
8 Inc 103,000 0 111,500 0 33,500 0 0 0 182,200 0 190,200 0 104,600 0 54,500 0 0 Delaware City refining Co LLC 182,200 0 190,200 0 104,600 0 54,500 0 147,500 0 152,000 0 71,000 0 0 11,000 0 Island Energy Services Downstream 54,000 0 57,000 0 31,000 0 0 0 Hawaii refining LLC 93,500 0 95,000 0 40,000 0 0 11,000 976,865 22,000 1,051,700 23,000 475,400 211,700 0 0 0 ExxonMobil refining & Supply Co 238,600 0 275,000 0 126,700 57,500 0 0 Petroleum Co LP 245,000 0 258,000 0 75,000 30,500 0 0 Midwest refining LLC 179,265 0 188,700 0 77,200 40,700 0 0 refining LP 314,000 22,000 330,000 23,000 196,500 83,000 0 0 442,300 0 460,800 0 277,900 102,000 0 0 0BP Products North America Inc 413,500 0 430,000 0 263,900 102,000 0 0 Cooperative Inc 28,800 0 30,800 0 14,000 0 0 0 389,920 0 400,500 0 156,000 74,000 0 0 0 CHS McPherson Refinery Inc 97,920 0 102,500 0 46,000 30,000 0 0 Resources Rfg & Mktg 132,000 0 136,000 0 46,000 25,000 0 0 El Dorado refining LLC 160,000 0 162,000 0 64,000 19,000 0 0 282,500 0 298,300 0 130,000 0 0 0 0 Continental refining Company LLC 5.
9 500 0 6,300 0 0 0 0 0 Energy Information Administration, Refinery Capacity 20188 Downstream Charge CapacityCatalytic CrackingCatalytic HydrocrackingCatalytic ReformingFreshRecycledDistillateGas OilResidualLowPressureHighPressureFuels SolventDeasphaltingTable 3. Capacity of Operable Petroleum Refineries by State as of January 1, 2018 State/Refiner/Location (Barrels per Stream Day, Except Where Noted)..California 718,500 14,600 197,700 283,400 0 197,800 210,700 56,000 Tesoro refining & Marketing 35,000 0 10,000 23,000 0 0 33,000 0 Torrance refining Co 90,000 13,600 28,300 0 0 0 20,000 0 Ultramar 56,300 0 0 0 0 18,000 0 0 Valero refining Co 75,300 0 34,000 0 0 0 37,200 0 0 0 0 0 0 0 30,000 500 0 0 0 21,900 0 0 Suncor Energy (USA)
10 City 30,000 500 0 0 0 21,900 0 82,000 4,000 0 22,300 0 43,800 0 0 Delaware City refining Co City 82,000 4,000 0 22,300 0 43,800 0 22,000 0 2,000 18,000 0 13,500 0 0 Island Energy Services 22,000 0 0 0 0 0 0 0 Par Hawaii refining 0 0 2,000 18,000 0 13,500 0 324,300 0 0 99,460 0 214,300 35,200 0 ExxonMobil refining & Supply 99,300 0 0 0 0 52,600 0 0 Marathon Petroleum Co 54,500 0 0 43,500 0 82,000 0 0 PDV Midwest refining 69,500 0 0 0 0 0 35,200 0 WRB refining River 101,000 0 0 55,960 0 79,700 0 183,600 7,200 0 0 0 6,500 65,000 0BP Products North America 175,000 7,000 0 0 0 0 65,000 0 Countrymark Cooperative Vernon 8,600 200 0 0 0 6,500 0
