Transcription of Table - Energy Information Administration
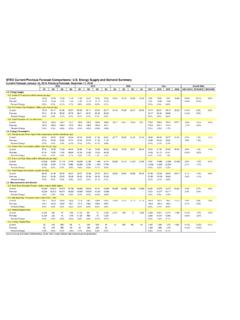
1 December 2021. Table 3. Table 3. Selected national average natural gas prices, 2016 2021. (dollars per thousand cubic feet , except where noted). Delivered to Consumers Natural Residential Commercial Industrial Electric NGPL Gas Composite Spot Citygate % of % of % of Power Year and Month Spot Pricea Priceb Price Price Totalc Price Totalc Price Totalc Priced 2016 Annual Average 2017 Annual Average 2018 Annual Average 2019. January February March April May June July August September October November December Annual Average 2020. January February March April May June July August September October November December Annual Average 2021. January February March April May June July August September October 2021 10 Month YTD 2020 10 Month YTD 2019 10 Month YTD a The natural gas plant liquid (NGPL) composite spot price, shown in dollars per million Btu ($/MMBtu), is derived from daily Bloomberg spot price data for natural gas plant liquids at Mont Belvieu, Texas, weighted by gas processing plant production volumes of each product as reported on Form EIA 816, Monthly Natural Gas Liquids Report.
2 See Appendix A, Explanatory Note 9, for full discussion. b The natural gas spot price, shown in $/MMBtu, represents the average of the daily closing spot prices for natural gas at the Henry Hub in Louisiana, taken from Refinitiv, an LSEG business. See Appendix A, Explanatory Note 9, for full discussion. c Percentage of total deliveries represented by onsystem sales (see Figure 6). See Table 24 for state data. d The electric power sector comprises electricity only and combined heat and power plants within the NAICS 22 category whose primary business is to sell electricity, or electricity and heat, to the public. Data include nonregulated members of the electric power sector. R. Revised data. Notes: Prices are in nominal dollars. Data for 2016 through 2019 are final. All other data are preliminary unless otherwise indicated. Geographic coverage is the 50. states and the District of Columbia. Published residential, commercial, and industrial prices are considered to be total prices paid by end users per thousand cubic feet of natural gas in the respective sectors, inclusive of all tax, delivery, commodity, demand and other charges.
3 Sources: 2016 2020: Energy Information Administration (EIA), Natural Gas Annual 2020. January 2021 through current month: Form EIA 857, Monthly Report of Natural Gas Purchases and Deliveries to Consumers; Form EIA 910, Monthly Natural Gas Marketer Survey; Form EIA 923, Power Plant Operations Report; Form EIA 816;. Bloomberg; Refinitiv, an LSEG business; and EIA estimates. Created on: Energy Information Administration | Natural Gas Monthly 12/22/2021 11:06:12 AM 7.
