Transcription of Technical notes - United Nations Development Programme
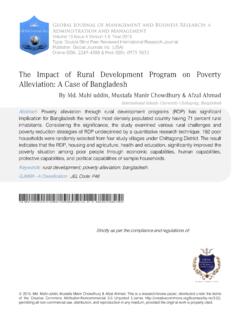
1 Technical notesCalculating the human Development indices graphical presentationInequality-adjustedHuman DevelopmentIndex (IHDI)KnowledgeMean yearsof schoolingExpected yearsof schoolingEducation indexLife expectancy indexHuman Development Index (HDI)Life expectancy at birthGNI indexGNI per capita (PPP $)DIMENSIONSINDICATORSDIMENSIONINDEXLong and healthy lifeA decent standard of livingHuman DevelopmentIndex (HDI)KnowledgeLong and healthy lifeA decent standard of livingYears of schoolingLife expectancyInequality-adjusted Human Development Index (IHDI)Life expectancy at birthIncome/consumptionGNI per capita (PPP $)HealthEducationSchoolattendanceYearsof schoolingHeadcountratioIntensityof povertyMultidimensional poverty Index (MPI)Standard of livingDIMENSIONSINDICATORSPOVERTY MEASURESM ultidimensionalPoverty Index (MPI)DIMENSIONSINDICATORSDIMENSIONINDEXH ealthEmpowermentFemale and male sharesof parliamentary seatsFemale and malepopulation with at leastsecondary educationFemale and male labour forceparticipation ratesFemale labourmarket indexLabour marketMaternal mortalityratioAdolescent birthrateDIMENSIONSINDICATORSG ender Inequality Index (GII)Gender Inequality Index (GII)Female empowermentindexFemalegender indexMalegender indexMale labourmarket indexMale empowermentindexFemale reproductivehealth indexDIMENSIONINDEXI nequality-adjustededucation indexInequality-adjustedlife expectancy indexInequality-adjustedincome indexINEQUALITY-ADJUSTED INDEXG ender Development Index (GDI)DIMENSIONSINDICATORSDIMENSION INDEXG ender Development Index (GDI)MaleFemaleMeanyears ofschoolingExpectedyears ofschoolingKnowledgeGNI per capita(PPP $)
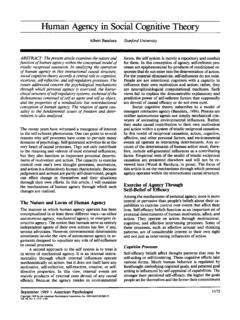
2 Standardof livingLong andhealthy lifeLife expectancyMeanyears ofschoolingExpectedyears ofschoolingKnowledgeGNI per capita(PPP $)Standardof livingLong andhealthy lifeLife expectancyHuman Development Index (female)Life expectancy indexGNI indexEducation indexLife expectancy indexGNI indexEducation indexHuman Development Index (male)NutritionChild mortalitySanitationCookingfuelDrinkingwa terElectricityHousingAssetsMean yearsof schoolingExpected yearsof schoolingTECHNICAL NOTES1 Technical note 1. Human Development IndexThe Human Development Index (HDI) is a summary measure of achievements in three key dimensions of human Development : a long and healthy life, access to knowledge and a decent standard of living. The HDI is the geometric mean of normalized indices for each of the three dimensions. This Technical note describes the data sources, steps to calculating the HDI, and the methodology used to estimate missing sources Life expectancy at birth: UNDESA (2019).
3 Expected years of schooling: UNESCO Institute for Statistics (2020), ICF Macro Demographic and Health Surveys (2008 2020), United Nations Children s Fund (UNICEF) Multiple Indicator Cluster Surveys (2008 2020) and OECD (2019). Mean years of schooling: UNESCO Institute for Statistics (2020), Barro and Lee (2018), ICF Macro Demographic and Health Surveys (2008 2020), UNICEF Multiple Indicator Cluster Surveys (2008 2020) and OECD (2019). GNI per capita: World Bank (2020), IMF (2020), United Nations Statistics Division (2020).Steps to calculate Human Development Index valuesThere are two steps to calculating HDI 1. Creating the dimension indicesMinimum and maximum values (goalposts) are set in order to transform the indicators expressed in dif-ferent units into indices between 0 and 1. These goalposts act as the natural zeros and aspiration-al targets , respectively, from which component indi-cators are standardized (see equation 1 below).
4 They are set at the following values:DimensionIndicatorMinimumMaximumH ealthLife expectancy (years)2085 EducationExpected years of schooling (years)018 Mean years of schooling (years)015 Standard of livingGNI per capita (2017 PPP$)10075,000 The justification for placing the natural zero for life expectancy at 20 years is based on historical ev-idence that no country in the 20th century had a life expectancy of less than 20 years (Maddison 2010; Oeppen and Vaupel 2002; Riley 2005). Maximum life expectancy is set at 85, a realistic aspirational target for many countries over the last 30 years. Due to constantly improving living conditions and medi-cal advances, life expectancy has already come very close to 85 years in several economies: years in Hong Kong, China (Special Administrative Region) and years in can subsist without formal education, jus-tifying the education minimum of 0 years.
5 The maxi-mum for expected years of schooling, 18, is equivalent to achieving a master s degree in most countries. The maximum for mean years of schooling, 15, is the pro-jected maximum of this indicator for low minimum value for gross national income (GNI) per capita, $100, is justified by the considera-ble amount of unmeasured subsistence and nonmar-ket production in economies close to the minimum, which is not captured in the official data. The maxi-mum is set at $75,000 per capita. Kahneman and De-aton (2010) have shown that there is virtually no gain in human Development and wellbeing from annual income above $75,000 per capita. Currently, only three countries (Liechtenstein, Qatar and Singapore) exceed the $75,000 income per capita defined the minimum and maximum val-ues, the dimension indices are calculated as:Dimension index =actual value minimum valuemaximum value minimum value.
6 (1)For the education dimension, equation 1 is first applied to each of the two indicators, and then the arithmetic mean of the two resulting indices is taken. Using the arithmetic mean of the two education indi-ces allows perfect substitutability between expected years of schooling and mean years of schooling, which seems to be right given that many developing coun-tries have low school attainment among adults but are very eager to achieve universal primary and second-ary school enrolment among school-age each dimension index is a proxy for ca-pabilities in the corresponding dimension, the 2 HUMAN Development REPORT / 2020transformation function from income to capabilities is likely to be concave (Anand and Sen 2000) that is, each additional dollar of income has a smaller ef-fect on expanding capabilities. Thus for income the natural logarithm of the actual, minimum and maxi-mum values is 2.
7 Aggregating the dimensional indicesThe HDI is the geometric mean of the three dimen-sional indices:HDI = (IHealth . IEducation . IIncome) 1/3 Example: SudanIndicatorValueLife expectancy at birth (years) years of schooling (years) years of schooling (years) national income per capita (2017 PPP $)3,829 Note: Values are index = 2085 20 = 1 Expected years of schooling index = 018 0 = years of schooling index = 015 0 = 513 Education index = + = index = ln(3,829) ln(100)ln(75,000) ln(100) = Development Index = ( 1 .. )1/3 = used to express incomeThe World Bank s 2020 World Development Indica-tors database contains estimates of GNI per capita in constant 2017 purchasing power parity (PPP) terms for many countries. For countries missing this indica-tor (entirely or partly), the Human Development Re-port Office (HDRO) calculates it by converting GNI per capita in local currency from current to constant terms using two steps.
8 First, the value of GNI per cap-ita in current terms is converted into PPP terms for the base year (2017). Second, a time series of GNI per capita in 2017 PPP constant terms is constructed by applying the real growth rates to the GNI per capita in PPP terms for the base year. The real growth rate is implied by the ratio of the nominal growth of GNI per capita in current local currency terms to the GDP several countries without a value of GNI per capita in constant 2017 PPP terms for 2019 reported in the World Development Indicators database, real growth rates of GDP per capita available in the World Development Indicators database or in the Interna-tional Monetary Fund s Economic Outlook database are applied to the most recent GNI values in constant PPP PPP conversion rates are produced by the International Comparison Program, whose surveys periodically collect thousands of prices of matched goods and services in many countries.
9 The last round of this exercise refers to 2017 and covered 176 missing valuesFor a small number of countries missing one of the four indicators, the HDRO estimated the missing val-ues using cross-country regression this Report expected years of schooling were es-timated for Bahamas, Congo, Equatorial Guinea, Fiji, Gabon, Haiti, Liberia, Libya and Vanuatu, and mean years of schooling were estimated for Comoros, Dji-bouti, Eritrea, Grenada, Lebanon, Madagascar, Fed-erated States of Micronesia, Saint Kitts and Nevis, South Sudan and Syrian Arab Development categoriesThe 2014 Human Development Report introduced a system of fixed cutoff points for the four categories of human Development achievements. The cutoff points (COP) are the HDI values calculated using the quar-tiles (q) from the distributions of the component indi-cators averaged over 2004 2013:COPq = HDI (LEq , EYSq , MYSq , GNIpcq), q = 1,2, NOTES3 For example, LE1, LE2 and LE3 denote three quartiles of the distribution of life expectancy across Report keeps the same cutoff points on the HDI for grouping countries that were introduced in the 2014 Report:Very high human and aboveHigh human human human developmentBelow Development Index aggregatesAggregate HDI values for country groups (by human Development category, region and the like) are cal-culated by applying the HDI formula to the weighted group averages of component indicators.
10 Life expec-tancy and GNI per capita are weighted by total pop-ulation, expected years of schooling is weighted by population ages 5 24 and mean years of schooling is weighted by population ages 25 and note 2. Inequality-adjusted Human Development IndexThe Inequality-adjusted Human Development Index (IHDI) adjusts the Human Development Index (HDI) for inequality in the distribution of each dimen-sion across the population. It is based on a distribu-tion-sensitive class of composite indices proposed by Foster, Lopez-Calva and Szekely (2005), which draws on the Atkinson (1970) family of inequality measures. It is computed as a geometric mean of in-equality-adjusted dimensional IHDI accounts for inequalities in HDI dimen-sions by discounting each dimension s average value according to its level of inequality. The IHDI value equals the HDI value when there is no inequality across people but falls below the HDI value as inequal-ity rises.