Example: barber
Testing for Normality - Shippensburg University
normal distribution can be determined. This distribution is based ... • Q-Q probability plots • Cumulative frequency (P -P) plots Statistical • W/S test • Jarque-Beratest ... Tests of Normality Age .110 1048 .000 .931 1048 .000 Statistic df Sig. Statistic df Sig.
Tags:
Information
Domain:
Source:
Link to this page:
Documents from same domain
Normal Distribution, Confidence Intervals for the Mean ...
webspace.ship.edua specific precision level can be estimated using the equation: where . δ(delta) is the detectible difference, s. 2 p is the sample variance, n is the sample size, and tα,v and tβ(1),v are the precision parameters taken from the t distribution table. If this equation is solved several times for various sample sizes

What is ICT literacy, and why measure it?
webspace.ship.edu1 1 ICT Literacy Assessment Information and Communication Technology Educational Testing Service (ETS) Teresa Egan, Project Leader, New Product Development

FOUR FORCES Natural Selection Mutation Genetic …
webspace.ship.eduFOUR FORCES Natural Selection Mutation Genetic Drift Gene Flow NATURAL SELECTION Driving Force - DIRECTIONAL Acts on variation in population Therefore, most be VARIATION to begin with

Hydrology: additional unit conversion problems …
webspace.ship.eduHydrology: additional unit conversion problems (solutions) 1. You measure a 4.5-inch distance of stream channel on a 1:50,000 scale topographic map.

Change Your Teaching the Marie Clay Way!
webspace.ship.eduSequential Processing Everything we do in mature reading and writing will rely on fast accurate perception of language sounds (captured by the ears) and visual symbols

Introduction to Data Science - webspace.ship.edu
webspace.ship.eduFeature engineering is the process of using domain knowledge about data to create features that are used in machine learning algorithms. Imagine 442 teams of data

Use the CSE (Council of Science Editors) format, using the ...
webspace.ship.eduCSE (Council of Science Editors, formerly CBE, Council of Biology Editors). Many of these styles draw upon two standard methods of citing sources: the author-date method and the numerical-sequence method (similar to numbered footnotes or endnotes).

Research Paper Requirements
webspace.ship.eduGrade loss for not meeting this requirement: 5% per component 3. Paper Length Paper length refers to the total number of text pages, excluding all figures, graphics, maps, and references. The paper length listed in the syllabus refers to the minimum number of full pages that are required. Papers can exceed this minimum requirement by one or two ...

Social Psychology Chapter 1 David Myers
webspace.ship.eduSocial Psychology Social Psychology - the study of how people think, influence, and relate to each other across different social situations –Applied Social Psychology –understanding what influences your life, your beliefs, your attitudes, and

Critical Values of the Spearman’s Ranked Correlation ...
webspace.ship.eduCritical Values of the Spearman’s Ranked Correlation Coefficient (r )s Taken from Zar, 1984 Table B.19. 20 rte rts 58 se sr so 18 n re n rs rr a o' o. 0 0 ' roo O ror 'ros o o o roe o o rro .rrr o rn o rre .rr8 o rso rsr 0. rStt .rse 0 no 0 ne o rtts ree rer rea o rss o o o o O sex 2sr o 200 .eoo o 20 ree o rao . ras o ratt ras raa
Related documents
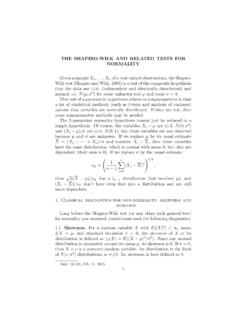
The normal distribution assumption and other assumptions.
mason.gmu.eduA lot of people don’t like “tests” of normality. In all cases you're trying to prove the H0, which is impossible! We won’t be covering them in this class, but if you ever do need to use ... QQ plots (sometimes called normal probability plots) - probably the best method for figuring out if something's normal. II. Making Q-Q plots ...

Point-Biserial and Biserial Correlations - NCSS
ncss-wpengine.netdna-ssl.comTests of Normality and Equal Variance ... The histograms and normal probability plots help you assess the viability of the assumption of normality within each group. Title: Point-Biserial and Biserial Correlations Author: NCSS, LLC Created Date: 12/30/2020 10:21:38 AM ...
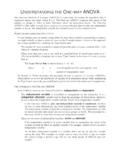
THE SHAPIRO-WILK AND RELATED TESTS FOR NORMALITY
math.mit.edun are actually i.i.d. with some normal distribution and n is fairly large, then S and K′should be close to 0. A statistic for testing normality called the Jarque–Berastatisticis JB := n 6 S2 + 1 4 K′2 . As n becomes large, if normality holds, the distribution of JB converges to a χ2 distribution with 2 degrees of freedom. The test was ...
Understanding the One-way ANOVA - Northern Arizona …
oak.ucc.nau.eduThe distributions of the populations from which the samples are selected are normal. This is commonly referred to as the assumption of normality. This assumption implies that the dependent variable is normally distributed (a theoretical ... Tests of Normality.182 10 .200* .930 10 .445.253 10 .068 .915 10 .314.164 10 .200* .968 10 .876

ASQ Six Sigma Green Belt Study Guide - Six Sigma Study Guide
sixsigmastudyguide.comas histograms, normal probability plots, etc. (Create) 4. Probability distributions. Describe and interpret normal, binomial, and Poisson, chi square, Student’s t, and F distributions. (Apply) 5. Measurement system analysis. Calculate, analyze, and interpret measurement system capability using repeatability and reproducibility (GR&R), measurement

The GENMOD Procedure - SAS
support.sas.comprobability distribution to be any member of an exponential family of distributions. Many widely used statistical models are generalized linear models. These include classical linear models with normal errors, logistic and probit models for binary data, and log-linear models for multinomial data. Many other useful
Learning Statistics with R
learningstatisticswithr.com4.9 Lists. . . . . . . . . . . . . . . . . . . . . . . . . . . . . . . . . . . . . . . . . . . . . . .102 4.10 Formulas ...