Example: barber
The GENMOD Procedure - SAS
probability distribution to be any member of an exponential family of distributions. Many widely used statistical models are generalized linear models. These include classical linear models with normal errors, logistic and probit models for binary data, and log-linear models for multinomial data. Many other useful
Tags:
Information
Domain:
Source:
Link to this page:
Documents from same domain

027-2009: Tips and Tricks for Creating the Reports …
support.sas.comPaper 027-2009 TIPS AND TRICKS FOR CREATING THE REPORTS YOUR CLIENTS NEED TO SEE Michael J Molter, INC Research, Raleigh, NC ABSTRACT Advanced reporting tools such as PROC REPORT have progressed by leaps and …

Step-by-Step Programming with Base SAS Software
support.sas.comThe correct bibliographic citation for this manual is as follows: SAS Institute Inc. 2001. Step-by-Step Programming with Base SAS® Software.Cary, NC: SAS Institute Inc.

227-2012: Executing a PROC from a DATA Step - …
support.sas.com2 Using RUN_MACRO to execute a PROC from a DATA step requires writing three blocks of code, described in the Introduction: a macro to execute a PROC, a user-written function to execute the macro, and a DATA step to call the

149-2012: Queries, Joins, and WHERE Clauses, Oh …
support.sas.comPaper 149-2012 Queries, Joins, and WHERE Clauses, Oh My!! Demystifying PROC SQL Christianna S. Williams, Chapel Hill, NC ABSTRACT Subqueries, inner joins, outer joins, HAVING expressions, set operators…just the terminology of PROC SQL might

158-2010: How to Use Arrays and DO Loops: Do I …
support.sas.com1 Paper 158-2010 How to Use ARRAYs and DO Loops: Do I DO OVER or Do I DO i? Jennifer L Waller, Medical College of Georgia, Augusta, GA ABSTRACT

248-2009: Learning When to Be Discrete: …
support.sas.com1 Paper 248–2009 Learning When to Be Discrete: Continuous vs. Categorical Predictors David J. Pasta, ICON Clinical Research, San Francisco, CA ABSTRACT

338-2011: An Introduction to Survival Analysis …
support.sas.com2 (Censored) Study Ends (From Applied Survey Data Analysis, p. 306) Figure 1. Prospective View of Event History Survey Data Time can be regarded as continuous or discrete and this basic distinction affects the analytic approach selected.

Dongsheng Yang and Jarrod E. Dalton - SAS
support.sas.com1 Paper 335-2012 A unified approach to measuring the effect size between two groups using SAS® Dongsheng Yang and Jarrod E. Dalton Departments of Quantitative Health Sciences and Outcomes Research

SAS/STAT 9.2 User's Guide: Introduction to Power …
support.sas.comSAS/STAT ® 9.2 User’s Guide Introduction to Power and Sample Size Analysis (Book Excerpt) SAS® Documentation

249-2012: A Tutorial on the SAS® Macro Language
support.sas.com1 Paper 249-2012 A Tutorial on the SAS® Macro Language John J. Cohen, Advanced Data Concepts LLC, Newark, DE ABSTRACT The SAS macro language is another language layering on top of regular SAS code.
Related documents
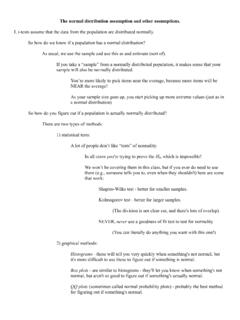
The normal distribution assumption and other assumptions.
mason.gmu.eduA lot of people don’t like “tests” of normality. In all cases you're trying to prove the H0, which is impossible! We won’t be covering them in this class, but if you ever do need to use ... QQ plots (sometimes called normal probability plots) - probably the best method for figuring out if something's normal. II. Making Q-Q plots ...
Testing for Normality - Shippensburg University
webspace.ship.edunormal distribution can be determined. This distribution is based ... • Q-Q probability plots • Cumulative frequency (P -P) plots Statistical • W/S test • Jarque-Beratest ... Tests of Normality Age .110 1048 .000 .931 1048 .000 Statistic df Sig. Statistic df Sig.

Point-Biserial and Biserial Correlations - NCSS
ncss-wpengine.netdna-ssl.comTests of Normality and Equal Variance ... The histograms and normal probability plots help you assess the viability of the assumption of normality within each group. Title: Point-Biserial and Biserial Correlations Author: NCSS, LLC Created Date: 12/30/2020 10:21:38 AM ...
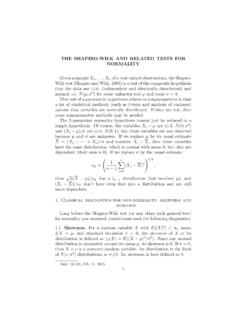
THE SHAPIRO-WILK AND RELATED TESTS FOR NORMALITY
math.mit.edun are actually i.i.d. with some normal distribution and n is fairly large, then S and K′should be close to 0. A statistic for testing normality called the Jarque–Berastatisticis JB := n 6 S2 + 1 4 K′2 . As n becomes large, if normality holds, the distribution of JB converges to a χ2 distribution with 2 degrees of freedom. The test was ...
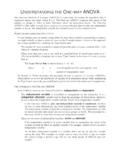
Understanding the One-way ANOVA - Northern Arizona …
oak.ucc.nau.eduThe distributions of the populations from which the samples are selected are normal. This is commonly referred to as the assumption of normality. This assumption implies that the dependent variable is normally distributed (a theoretical ... Tests of Normality.182 10 .200* .930 10 .445.253 10 .068 .915 10 .314.164 10 .200* .968 10 .876

ASQ Six Sigma Green Belt Study Guide - Six Sigma Study Guide
sixsigmastudyguide.comas histograms, normal probability plots, etc. (Create) 4. Probability distributions. Describe and interpret normal, binomial, and Poisson, chi square, Student’s t, and F distributions. (Apply) 5. Measurement system analysis. Calculate, analyze, and interpret measurement system capability using repeatability and reproducibility (GR&R), measurement
Learning Statistics with R
learningstatisticswithr.com4.9 Lists. . . . . . . . . . . . . . . . . . . . . . . . . . . . . . . . . . . . . . . . . . . . . . .102 4.10 Formulas ...