Transcription of THE SPRING CONSTANT - The University of …
1 UTC Physics 1030L: SPRING CONSTANT 66 THE SPRING CONSTANT Objective: To determine the SPRING CONSTANT of a spiral SPRING by Hooke s law and by its period of oscillatory motion in response to a weight. Apparatus: A spiral SPRING , a set of weights, a weight hanger, a balance, a stop watch, and a two-meter stick. Theory: The restoring force, F, of a stretched SPRING is proportional to its elongation, x, if the deformation is not too great. This relationship for elastic behavior is known as Hooke's law and is described by F = -kx (eq. 1), where k is the CONSTANT of proportionality called the SPRING CONSTANT . The SPRING s restoring force acts in the opposite direction to its elongation, denoted by the negative sign.
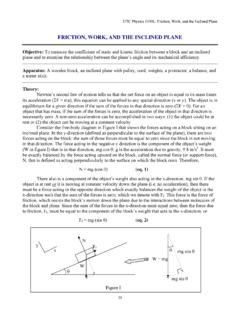
2 For a system such as shown in figure 1, the SPRING 's elongation, x x0, is dependent upon the SPRING CONSTANT , k, and the weight of a mass, mg, that hangs on the SPRING . If the system of forces is in equilibrium ( , it has no relative acceleration), then the sum of the forces down (the weight) is equal and opposite to the sum of the forces acting upward (the restoring force of the SPRING ), or m g = k (x x0) (eq. 2). Comparing equation 2 with the form for the equation of a straight line (y = mx + b), we can see that if we plot the force produced by different masses (mg) as a function of the displacement from equilibrium (x-x0), the data should be linear and the slope of the line will be equal to the SPRING CONSTANT , k, whose standard metric units are N/m.
3 If the mass is pulled so that the SPRING is stretched beyond its equilibrium (resting) position, the restoring force of the SPRING will cause an acceleration back toward the equilibrium position of the UTC Physics 1030L: SPRING CONSTANT 67spring, and the mass will oscillate in simple harmonic motion. The period of vibration, T, is defined as the amount of time it takes for one complete oscillation, and for the system described above is: kmTe 2= (eq. 3), where me is the equivalent mass of the system, that is, the sum of the mass, m, which hangs from the SPRING and the SPRING 's equivalent mass, me- SPRING , or me = m + me- SPRING (eq. 4). Note that me- SPRING is not the actual mass of the SPRING , but is the equivalent mass of the SPRING .
4 It is not the actual mass because not all of the mass pulls down to act in concert with the weight pulling down. Its theoretical value for our system should be approximately 1/3 of the actual mass of the SPRING . Substituting equation 4 into equation 3 and squaring both sides of the equation yields: ()springemmkT +=224 . Expanding the equation: springemkmkT +=22244 (eq. 5). Therefore, if we perform an experiment in which the mass hanging at the end of the SPRING (the independent variable) is varied and measure the period squared (T2; the dependent variable), we can plot the data and fit it linearly. Comparing equation 5 to the equation for a straight line (y = mx + b), we see that the slope and y-intercept, respectively, of the linear fit is: kslope24 = and y-intercept springemk =24 (eq.)
5 6). Procedure and Data Analysis: Suggestion: After taking data in part I, step 5 for a given mass, continue on to part II, right away since the same mass is used. Then repeat the same procedure with the other three masses. PART I. Determination of the SPRING CONSTANT by Hooke s law. 1. Using a 2-meter stick with zero end on the top and the 200 cm (2 m) end on the floor (as shown in figure 1), read the position of the last coil of the freely hanging spiral SPRING and record it on your data sheet as x0. 2. Hang an approximate kg mass to the SPRING . Remember to include the mass of the hanger and weigh the masses on a balance. Record this mass in column 1 on your data sheet for part I.
6 3. In column 2 on the data sheet, calculate the weight of the mass using F = mg, where m is in kg and g is m/s2. 4. Read xi, the position of the same last coil of the SPRING as in step 1 (shown in figure 1). Record this distance in column 3 on your data sheet for part I. UTC Physics 1030L: SPRING CONSTANT 685. In the fourth column on the data sheet, calculate the total displacement of the last coil of the SPRING , x, by x = xi x0. 6. Repeat steps 2-5 for masses approximately equal to kg, kg, and kg. 7. Make a graph of the force, F, versus displacement ( x). You will have five data points for this graph: the four data points for each of the four masses, and an additional data point at (0,0).
7 This data point is valid because when 0 kg hung on the SPRING , it was displaced 0 m from its equilibrium position. 8. Fit the data with a linear function in the form of y = mx + b. Determine the value of the SPRING CONSTANT from the slope of the best-fit line. In order to make a graph with a linear fit in Excel 2007: a. Label column A as your independent variable (whatever you would like plotted on the x-axis) and type in your values. Label column B as your dependent variable (which will be values plotted on the y-axis) and type in your values. b. In order to make a graph of the dependent vs. the independent variable, highlight the data in columns A and B. c. On the Insert tab and the Charts toolbar, click on Scatter.
8 Select the Scatter with only Markers plot option (Do not connect the points with a line this is not a best fit). d. When the graph is selected, the Chart tools appear. Under the Design tab, click on Move Chart, and select New Sheet . e. Add an appropriate chart title and axis titles under the Layout menu of the Chart Tools. f. Unless your data contains more than one series, highlight and delete the legend. g. Under the Chart Tools Layout tab, and the Analysis tools, click Trendline and More Trendline Options (shown on the next page). Select the Linear regression type and check the options for Display Equation on chart and Display R-squared value on Chart. h.
9 The equation of the line and the estimate of the goodness of its fit (R2) should now appear on your chart. A value of R2 that is equal to 1 would indicate a perfect correlation. Print the graph. UTC Physics 1030L: SPRING CONSTANT 69 PART II. Determination of the SPRING CONSTANT by its period of oscillation in response to different masses. 1. Weigh the SPRING on a balance and record its mass on your data sheet. 2. Hang an approximate kg mass from the spiral SPRING . (Be sure to record the actual mass on your data sheet for part II). 3. Start the oscillation in a vertical direction by pulling gently down on the mass and releasing it (an initial displacement of 2-3 cm works best).
10 Measure the amount of time required for twenty complete oscillations with a stop watch, and record it as t1 on your data sheet. 4. Repeat step 2-3 three times and find the average. Record this as tavg on your data sheet. 5. Calculate T, the system's period for one oscillation, dividing tavg by 20. Record this on your data sheet. 6. Repeat step 2-5 for masses approximately equal to kg, kg, and kg. 7. Calculate the values of T2 and record them in the appropriate column on your data sheet. 8. Make a graph of T2 vs. mass, m. Note: There are only four data points for this experiment. There is no (0,0) data point because a mass of 0 kg produced no oscillatory motion.