Transcription of Transformations of Functions - Alamo Colleges District
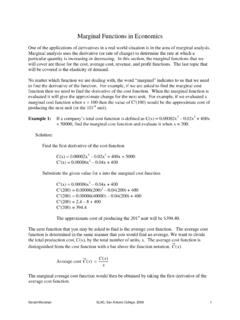
1 Transformations of Functions An alternative way to graphing a function by plotting individual points is to perform Transformations to the graph of a function you already know. Library Functions : In previous sections, we learned the graphs of some basic Functions . Collectively, these are known as the graphs of the library Functions . These are the graphs of the Functions we will begin to perform Transformations on to find the graphs of other Functions . We will discuss three types of Transformations : shifting, reflecting, and stretching/shrinking.
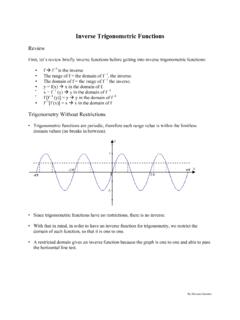
2 Vertical Shifting: Adding a constant to a function will shift its graph vertically ( y = f (x) + c ). Adding a positive constant c will shift the graph upward c units, while adding a negative constant c will shift it downward c units. Example 1: Sketch the graph of each function. (a) h (x) = x2 + 2 (b) g (x) = |x| 3 Solution (a): Step 1: First, we determine which library function best matches our given function. Since our function has an x2 in it, we will use the library function f (x) = x2. Step 2: Now that we know the library function we will be using, we need a set of points from the graph of f (x) = x2 to work with.
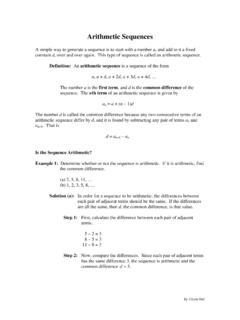
3 We can choose any points from the graph, but let s choose some easy ones. Step 3: The function h (x) = x2 + 2 is of the form y = f (x) + c, so we know the graph of h (x) will be the same as that of f (x), but shifted upward 2 units. Thus, we can obtain points on the graph of h (x) by taking our points from the graph of f (x) = x2 and adding 2 to each of the y-values. Example 1 (Continued): Step 4: Thus we have obtained the graph of h (x) = x2 + 2 by transforming the graph of f (x) = x2. Solution (b): Step 1: First, we determine which library function best matches our given function.
4 Since our function has an |x| in it, we will use the library function f (x) = |x|. Step 2: Now we choose a set of points from the graph of f (x) = |x| to work with. Example 1 (Continued): Step 3: The function g (x) = |x| 3 is of the form y = f (x) c, so we know the graph of g (x) will be the same as that of f (x), but shifted downward 3 units. Thus, we can obtain points on the graph of g (x) by taking our points from the graph of f (x) = |x| and subtracting 3 from each of the y-values. Step 4: Thus we have obtained the graph of g (x) = |x| 3 by transforming the graph of f (x) = |x|.
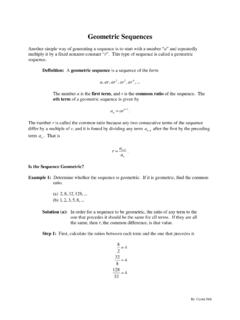
5 Horizontal Shifting: A horizontal shift is represented in either the form y = f (x c) or y = f (x + c). Suppose we know the graph of y = f (x). The value of f (x c) at x is the same as the value of f (x) at x c. Since x c is c units to the left of x, it follows that the graph of y = f (x c) is just the graph of y = f (x) shifted to the right c units. Likewise, the graph of y = f (x + c) is the graph of y = f (x) shifted to the left c units. Example 2: Sketch the graph of each function. (a) h (x) = (x + 3)2 (b) ()4gxx= Solution (a): Step 1: First, we determine which library function best matches our given function.
6 Since our function has an (x + 3)2 in it, we will use the library function f (x) = x2. Example 2 (Continued): Step 2: Now we choose a set of points from the graph of f (x) = x2 to work with. Step 3: The function h (x) = (x + 3)2 is of the form y = f (x + c), so we know the graph of h (x) will be the same as that of f (x), but shifted left 3 units. Thus, we can obtain points on the graph of h (x) by taking our points from the graph of f (x) = x2 and subtracting 3 from each of the x-values. Step 4: Thus we have obtained the graph of h (x) = (x + 3)2 by transforming the graph of f (x) = x2.
7 Example 2 (Continued): Solution (b): Step 1: First, we determine which library function best matches our given function. Since our function has an 4x in it, we will use the library function ()fxx=. Step 2: Now we choose a set of points from the graph of ()fx=x to work with. Step 3: The function ()4gxx= is of the form y = f (x c), so we know the graph of g (x) will be the same as that of f (x), but shifted right 4 units. Thus, we can obtain points on the graph of g (x) by taking our points from the graph of ()fx=x and adding 4 to each of the x-values.
8 Example 2 (Continued): Step 4: Thus we have obtained the graph of ()4gxx= by transforming the graph of ()fxx=. Reflecting Graphs: If we know the graph of y = f (x), we can obtain the graph of its reflection in the x-axis by multiplying the y-coordinate of each point on the graph of y = f (x) by 1. This would give the graph of y = f (x). Similarly, the value of y = f ( x) at x is the same as the value of y = f (x) at x, and so the graph of y = f ( x) is the reflection of the graph of y = f (x) in the y-axis. Example 3: Sketch the graph of each function.
9 (a) h (x) = x3 (b) ()3gxx= Solution (a): Step 1: Since our function has an x3 in it, we will start with the library function f (x) = x3. Choose a set of points from the graph of f (x) = x3 to work with. Step 2: The function h (x) = x3 is of the form y = f (x), so we know the graph of h (x) will be the same as that of f (x), but reflected in the x-axis. Thus, we can obtain points on the graph of h (x) by multiplying the y-coordinate of each point from the graph of f (x) by 1.
10 Step 3: Thus we have obtained the graph of h (x) = x3 by transforming the graph of f (x) = x3. Example 3 (Continued): Solution (b): Step 1: Since our function has an 3x in it, we will start with the library function ()3fx=x. Choose a set of points from the graph of ()3fx=x to work with. Step 2: The function ()3gxx= is of the form ()yf x= , so we know the graph of will be the same as that of ()gx()fx, but reflected in the y-axis. Thus, we can obtain points on the graph of ()gx by taking our points from the graph of ()3fx=x and multiplying each of the x-values by -1.