Transcription of Tutorial – Creating a regular grid for point sampling
1 Tutorial Creating a regular grid for point sampling Generate a regular grid of sampling points Page 1 of 5 2012 Michael D. Hyslop Michigan Technological University This Tutorial describes how to use the fishnet, clip, and optionally the buffer tools in ArcGIS 10 to generate a regularly-spaced grid of sampling points inside a polygon layer. The steps below should work with any license level: ArcGIS for Desktop Basic (ArcView), ArcGIS for Desktop Standard (ArcEditor), and ArcGIS for Desktop Advanced (ArcInfo). 1. Prepare your features in which sampling will occur. This should be a polygon feature class ( , soils, vegetation, or ownership polygons). It will be simplest if the features in which you wish to sample are in their own layer. Add the polygon layer to a new map document and verify that the coordinate system / map projection for the data frame is set correctly.
2 Figure 1: parcel to sample (tan) and data frame coordinate system properties 2. Open the Create Fishnet (Data Management) tool. You may use the search window (Ctl-F or Window > Search and enter fishnet) or open ArcToolbox and expand Data Management Tools > Feature Class > Create Fishnet. Figure 2: Create Fishnet tool in the search window Tutorial Creating a regular grid for point sampling Generate a regular grid of sampling points Page 2 of 5 2012 Michael D. Hyslop Michigan Technological University 3. Set the output feature class (shapefile or geodatabase feature class) and set the Template Extent to Same as layer <your polygon layer created in step 1>, , if your layer in step 1 was a feature class named parcel , you would set the Template Extent to Same as layer parcel. 4.
3 Enter the desired point spacing in Cell Size Width and Cell Size Height. These values should be in the units your layer s projection uses (probably meters). 20 meters is about a chain, so to use 2-chain spacing you would enter 40 for both the Cell Size Width and Cell Size Height values. If using set a cell size, enter 0 for both the number of rows and columns (these will be determined automatically). You can also choose the number of rows and columns desired and the point spacing will be set automatically, though for most sampling it s simpler to adjust the distance. 5. Ensure Create Label points (optional) is checked and set the Geometry Type (optional) to Polygon. Click OK to generate the lattice point labels and polygons. Figure 3: Create Fishnet tool options and output results (polygons and points ) Tutorial Creating a regular grid for point sampling Generate a regular grid of sampling points Page 3 of 5 2012 Michael D.
4 Hyslop Michigan Technological University 6. The new layers will be added to your map. Turn off the polygon layer and open the Clip (Analysis) tool (use the Search window or open ArcToolbox and expand Analysis Tools > Extract > Clip). Set your lattice points (labels) as Input Features and the layer you are sampling in (from step 1) as the Clip Features. Choose an Output Features layer and click OK to clip your points . This step is necessary because a lattice is always square (or rectangular) and unless the area you are sampling in is also square or rectangular, the lattice extent will be partially outside its polygons. Figure 4: Clip results. Note many sampling locations appear near or on the parcel border. 7. Optional step: if you wish to keep your sampling points a set distance away from the boundaries of your parcel, use the Buffer tool (Analysis Tools > Proximity > Buffer) and generate an inside buffer in your sampling area.
5 Your area to be sampled will be the Input Features, choose a new shapefile or feature class as the Output Features, and use a negative value as the buffer Distance value. A value of -20 meters would keep the sample points a chain away from the parcel boundaries. Use the output from this step as the Clip Features in step 6. Figure 5: Buffer tool in the ArcToolbox window and clip results using a 20 meter inside buffer (green). Note no sampling points are within a chain of the parcel s border. Tutorial Creating a regular grid for point sampling Generate a regular grid of sampling points Page 4 of 5 2012 Michael D. Hyslop Michigan Technological University 8. Generating sampling points is an iterative process. You will likely need to repeat the steps above to increase (or decrease) the point spacing.
6 Adjustments will differ depending on the acreage you are sampling , the shape of the parcel(s), and any buffers you may use to avoid the edges of the parcel. The 40 meter (2 chain) spacing used in the example above produced 138 sampling locations in a 36 Ha (88 acre) area, about four times what is suggested by the 16 points per 40 rule of thumb for overstory sampling . An 80-meter spacing (about 4 chains) yielded 38 sampling points , as shown below. Figure 6: Results of 80-meter point spacing grid . 9. Once you are satisfied with the number and arrangement of your sampling points , the last step is to generate a unique identifier for each point , but first you will need to create an empty field to hold this information. Open the attribute table for your point shapefile. Click the Table Options button (top left) and choose Add Field. Name it something useful ( , ID , UID , or Name ) and choose a field Type.
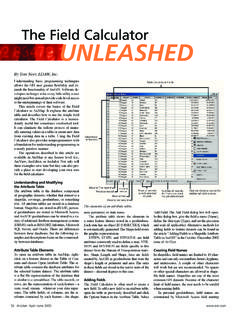
7 If you simply wish to number the points use a Short Integer field. If you want to include something more descriptive such as text and numbers in the field, choose a Text field and set the length to an appropriate value. Figure 7: Add a field to a table. Tutorial Creating a regular grid for point sampling Generate a regular grid of sampling points Page 5 of 5 2012 Michael D. Hyslop Michigan Technological University 10. As a final step you should use the field calculator to populate your new field. This will help you keep track of and identify your points . Right-click on the heading of the field you created in step 9 and choose Field Calculator. Click in the box in left center part of the window, just below Fieldname= and build your expression. Existing fields are listed at the top left of the window but are shown in brackets in your field calculator expression.
8 Double-clicking on a field from the list is the easiest way to use it in your expression. The expression UID= [OBJECTID] would number your points from 1 to N. UID= [OBJECTID]+99 would number the points from 100 to 100+N. point & &[OBJECTID] would label each point as point N, , point 1, point 2 (if you are using a text ) Text in a text field must be added in quotes, and the ampersand (&) acts to concatenate the statement parts. This expression parses as put the word point and a space and the object ID in the output field . See the help topics Calculate field examples and Fundamentals of field calculations for more information on and examples using the field calculator. Figure 8: Calculating a value of record number +99 for the field UID.