Transcription of Uniaxial Tension and Compression Testing of Materials
1 Uniaxial Tension and Compression Testing of Materials Nikita Khlystov Daniel Lizardo Keisuke Matsushita Jennie Zheng Lab Report September 25, 2013 I. Introduction Understanding material mechanics is critical for engineering. The Uniaxial Tension and Compression tests provide a simple and effective way to characterize a material's response to loading. By subjecting a sample to a controlled tensile or compressive displacement along a single axis, the change in dimensions and resulting load can be recorded to calculate a stress-strain profile. From the obtained curve, elastic and plastic material properties can then be determined. Therefore, to investigate material mechanics and gain experience in Uniaxial Testing , we performed compressive and tensile tests on alloys, pure metals, and ceramics, and calculated their Young s modulus, yield stress, ultimate tensile strength, and elastic strain energy density.
2 Uniaxial Testing For Uniaxial tests, the displacement is typically held at a constant rate, and displacement and resulting load are recorded. The load is measured by a series of strain gages, or load cell, while the displacement can be recorded as displacement of the crosshead, or the beam on which the specimen load frame is mounted. For more precise load measurements, strain gages or an extensometer can be directly fixed to the specimen. To make direct comparisons between Materials , loading responses must be normalized against sample geometry. Therefore, the dimensions of each sample are noted to compute stress and strain from load and displacement, respectively. Engineering strain can be calculated as: e = L/Lo (1) Where L is the measured displacement and Lo is initial sample length along a single axis. Engineering stress can be calculated as: e = P/Ao (2) Where P is the applied load and Ao is the initial cross sectional area of the sample normal to the loading direction.
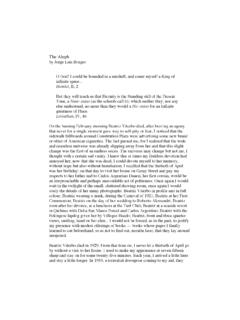
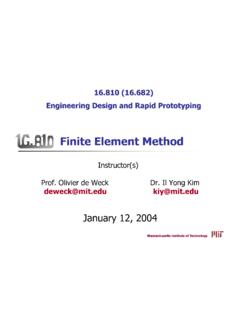
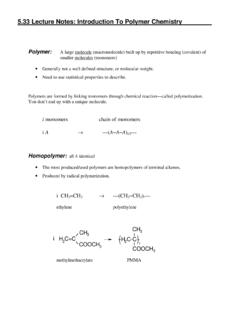
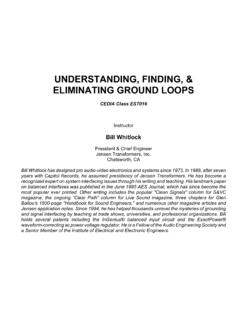
3 In tensile tests, specimens typically have two shoulders and a gauge section in between, as so: Fig. Typical tensile Testing specimen1 The shoulders are large so that they may be gripped by the Testing apparatus. The neck, as a region of reduced cross-sectional area, localizes stress and ensures that failure consistently occurs near the middle. The cross sectional area, Ao, may be taken as that of the neck region. In compressive tests, specimens are typically cylinders. The stress-strain profile With the sample geometry, a stress-strain curve can then be generated from the recorded load and displacement. A typical stress-strain profile for a ductile metal resembles the following: Fig. Typical stress-strain curve of a ductile metal2 The material initially behaves in a linear elastic manner: stress and strain are linearly related, and on unloading, the deformation is recoverable. The slope within the linear elastic regime is Young s modulus, or the ratio of the engineering stress to engineering strain in the axis: E = e/ e (3) E characterizes the stiffness of a material in units of force per unit area (N/m2, or Pa).
4 The area under the elastic portion of the curve therefore defines the elastic strain energy density in units of energy per unit volume (J/m3): U = (4) A material s maximum capacity to elastically absorb energy is then the total area under the stress-strain curve s linear elastic regime: Uelmax = y y (5) Where y and y are the yield stress and yield strain at which linear elastic behavior ceases. At larger strains, material deformation becomes irrecoverable and non-linear, or plastic. Along with y and y, the offset yield stress, or the stress that corresponds to irrecoverable strain on unloading, is used as a convention to characterize the transition. In the plastic region, the material will also exhibit its ultimate tensile stress, or the maximum load divided by the initial cross-sectional area: ult = Pmax/Ao (6) To gain experience in Uniaxial Testing and better understand material mechanics, we will obtain E, y, max, max, and Uelmax of pure metals and alloys, as well as ceramics.
5 Differences in their atomic structure will account for differences in their mechanical properties. For example, alloys typically have larger values of E than their pure counter-parts, due to the presence of substitutional atoms which impede the movement of dislocations. Ceramics will exhibit brittle behavior and high stiffness relative to metals, due to the directionality of their covalent bonds. Covalent bonds of a ceramic will resist deformation when a force is applied, but break when the threshold is passed, whereas the delocalized nature of the bonds in metals allows for plastic deformation, or ductile behavior. 2. Materials and Methods Uniaxial Tension For this section of the laboratory experiment, a metal (Cu, ) and three metal alloys ( -brass [ Cu, 35% Zn, 1% Pb], aluminum 6061, and steel 1045) were subjected to Uniaxial Tension using the Instron Model 4505. The samples were dog-bone structures to localize the point of failure to the center of the samples during Testing (Fig.)
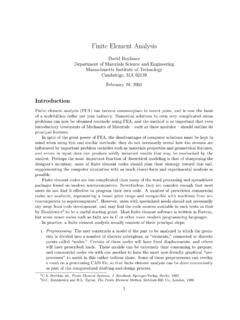
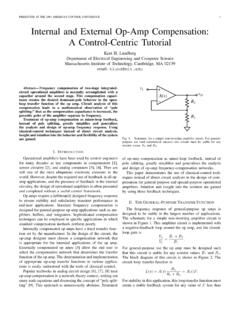
6 The initial sample dimensions (width and thickness) were measured, and then the samples were mounted into the fixed lower base of the Instron 4505 (Table , Fig. ). The gage length L between the fixed lower base and upper fixture was measured to determine the initial length of the sample undergoing Uniaxial Tension . Fig. Copper, brass, aluminum, and steel samples for tensile Testing . Each set of Materials contain samples before (right) and after (left) tensile Testing . Sample Width (mm) Thickness (mm) Initial L (mm) Steel Al 6061 Cu Brass Table Initial gage dimensions (width, thickness, and initial length, in mm) of the specimens. Fig. Brass sample between the lower base and upper fixture that had undergone Uniaxial tensile Testing . Using the Instron Series IX Software, the force-displacement responses of each of the material at a displacement rate of 15 mm/min were acquired.
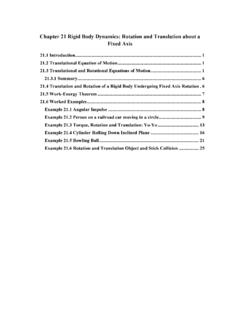
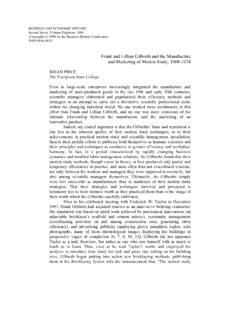
7 The tests ended when the specimens fractured. After Testing one sample of each material, a second round of tensile tests were performed on both the brass and steel samples to observe variations in mechanical properties for a single material. Uniaxial Compression This section of the laboratory experiment involved subjecting Cu ( ), -brass ( Cu, 35% Zn, 1% Pb), aluminum 6061, steel 1045, and alumina (porous and non-porous) to Uniaxial Compression using the Instron Model 4206 (Fig. ). Two measurements of the initial gage dimensions of the specimens were taken and averaged to obtain the dimensions that appear in Table The samples were then placed between the Compression anvils to commence Uniaxial Compression Testing (Fig. ). Fig. Porous Al2O3, Non-Porous Al2O3, aluminum, brass, steel, copper. Each pair of Materials contain samples before (left) and after (right) Compression Testing . Sample Height (mm) Diameter (mm) Steel Al 6061 Cu Brass Table Initial gage dimensions (height and diameter, in mm) of the specimens.
8 Aluminum sample between the Compression anvils. To measure the strains of the samples within the elastic range, the specimens were loaded into the Instron 4206 with the extensometer directly attached to the sample. The samples were then unloaded, had the extensometer removed, and then compressed again up to a 5 mm maximum displacement. A second limit of 100 kN was set to protect the instrument from applying a load greater than its capable load. The extensometer -loading test was not performed on the porous and non-porous alumina. Bluehill 2 Software was used to generate force-displacement curves. Calculation of Mechanical Properties The force-displacement responses were re-plotted in terms of engineering stress and strain to calculate E, y, max, max, and Uelmax. Using the measured dimensions of the samples and Eqn. 1, 2 and 3, the Young s modulus, E, was calculated. The yield stress, y, was calculated by determining the offset yield strain, forming a line with a slope equal to the Young s modulus with that yield strain as the x-intercept, and locating the point where this line intersected the stress-strain curve.
9 The values for yield stress and yield strain were used along with Eqn. 5 to calculate values for Uelmax , the material s maximum capacity to elastically absorb energy. The maximum stress and strain for the Uniaxial Tension tests were determined by finding the local maximum of the stress-strain curve before fracture of the samples occurred. 3. Results Uniaxial Tension Figure shows the measured stress versus strain data for brass, aluminum (alloy 6061), copper, and steel specimen tested under Tension . Two specimens each of brass and steel were tested. The four different types of metals featured varying behaviors under Tension , highlighting their different mechanical properties (Table ). Brass underwent the greatest amount of necking, and accordingly its strain at failure ( ) was the greatest out of the four metals. Steel was found to be comparably ductile ( ), while aluminum ( ) and copper ( ) were more brittle.
10 Steel was found to be the strongest of the four metals with an ultimate tensile strength of MPa, while brass was close at MPa. Although relatively brittle, copper s ultimate tensile strength ( MPa) is greater than that of aluminum ( MPa). A similar ranking was observed for the metals behavior in yielding: steel had the highest yield strength ( MPa), followed by brass ( MPa), copper ( MPa), and aluminum ( MPa). Steel was found to be considerably tougher than the other three metals, having an elastic modulus of GPa. Copper s toughness (E = GPa) was comparable to that of brass (E = GPa), while aluminum (E = GPa) was found to be the most elastic of the metals. The energy stored in Tension for the four metals was similarly ordered, with steel and brass having the highest maximum stored elastic energy (121 and 128 kJ/m3 respectively). Copper tolerated a moderate amount of tensile energy before yielding ( kJ/m3) while aluminum yielded under the least amount of tensile energy ( kJ/m3).